
What is a value center?
A value center is a crucial component of a business. It is a function, a team, or a department that plays a vital role in boosting the company’s profit. A value center brings tangible benefits to the organization by optimizing costs, generating revenue, or even doing both at the same time. Moreover, a value center identifies new revenue-generating prospects by exploring new markets, and innovating products and services.
Is CRO a value center?
A cost center refers to a department or unit that does not directly contribute to the company’s profit. In some cases, Conversion Rate Optimization (CRO) is perceived as a cost center since its outcomes may not always yield tangible results in a short period and give occasional failures.
While CRO initiatives can encounter challenges, it is crucial to recognize the long-term value they bring to the organization. CRO can be turned into a value center by leveraging continuous experimenting and optimization of strategies to improve conversion rates and enhance overall organizational performance. Even failures in CRO experiments can serve as a valuable foundation for future success, as they provide invaluable insights and learnings that contribute to creating an experimentation loop.
Moreover, CRO acts as an enabler of efficiency within the business. By testing and refining different elements of a customer’s journey, CRO helps identify and eliminate bottlenecks, streamline processes, and enhance the overall user experience. This, in turn, accelerates growth by maximizing the conversion of visitors into customers and maximizing the value derived from each interaction.
How to make CRO a value center
Let’s understand how to make conversion rate optimization (CRO) a profitable investment (value center) with some real-life examples.
a. Create a CRO cycle to increase revenue
Revenue is the fruit of an optimized visitor journey that starts via landing pages on different devices. Many organizations need to avoid expecting results with few tests. CRO is not a magic wand that will uplift revenue in a single campaign or a few days. It requires constant efforts to optimize each stage of the visitor journey, from the landing page to the checkout page.
For instance, GRENE, an agriculture wholesaler, utilized VWO to optimize the conversion funnel. The company ran a series of experiments for the 2018-19 financial year. The experiments included the A/B testing homepage, checkout page, product section, etc. This whole optimization exercise resulted in a whopping 59.9% increase in revenue. Such a staggering growth in revenue makes CRO the value center of GRENE.
CRO can become a value center when you create a strong hypothesis and identify revenue-affecting elements at each conversion funnel stage. Then, with a constant CRO cycle of testing-learning-optimizing, you craft an optimized conversion funnel that increases revenue. CRO reaps rewards with consistency and not with one-time initiatives.
b. Turn failures into information goldmines
Many companies give up on CRO because of failing to achieve desired goals. However, a failure in CRO is a goldmine of information that can be a foundation for future optimization. Here is one great example of the same.
Uncommon Knowledge, an online education portal, tested its lead generation page to see an uplift in leads. The team at the company created a variation of the lead generation page with new design trends, while the original version had a traditional magazine layout.
At the end of the test, the team found that the old page beat the new one by a 19.55% conversion rate. The optimization efforts were unsuccessful, but the insight from it was a goldmine for the team. It came to their notice that the majority of their target audience is aged 45+.
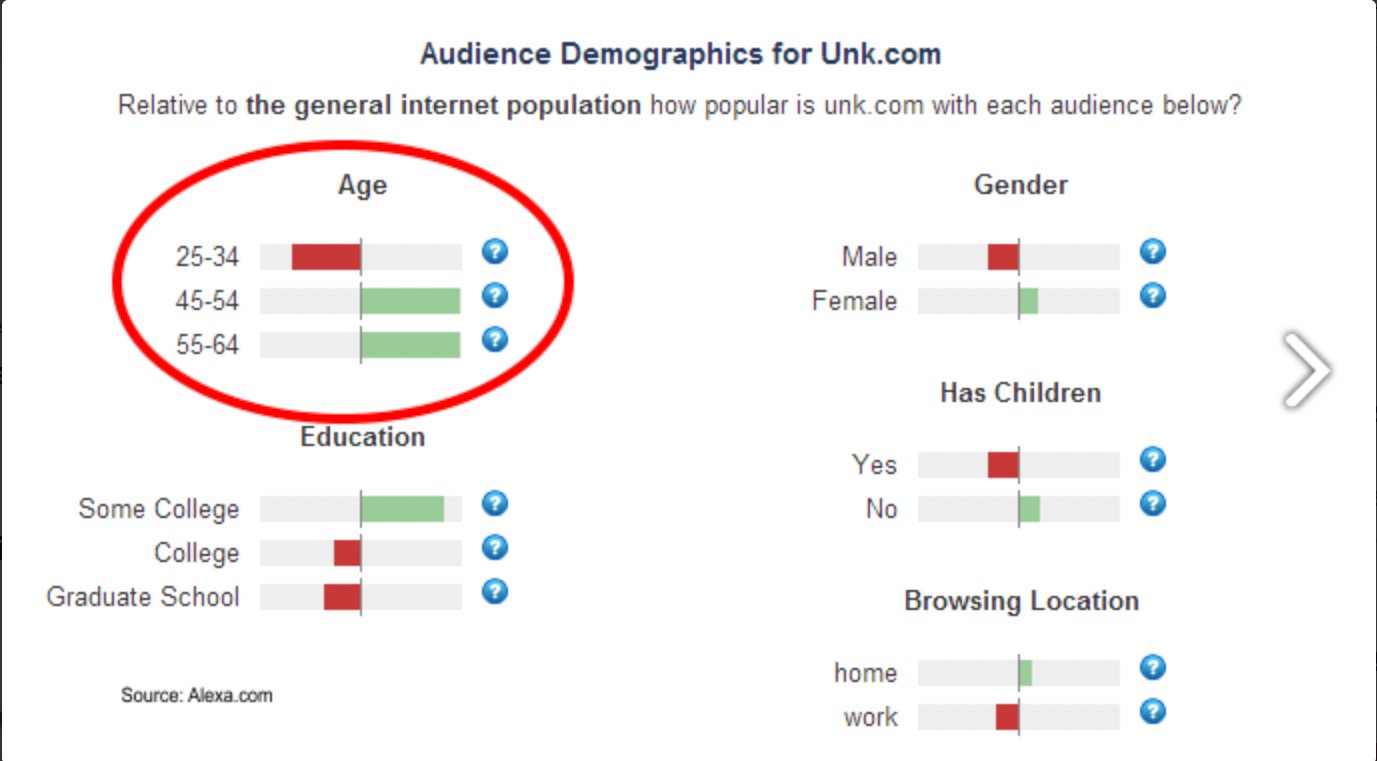
The new design trend was not relevant to the target group, and the failed test validated that relevance is the key to conversion, not the trend. Thus, even a failed experiment can become a foundation for the next optimization effort. So, CRO is a value center, even if you face failures.
c. Run experiments to retain customers
You can increase your website value by constantly acquiring new visitors or retaining returning visitors. But, it’s always easy and more affordable to retain a returning visitor than a new one. That’s why every business is in a race to increase the visitor’s lifetime value, which is the monetary benefit that a single visitor delivers to a company. CRO is a value center because it increases the visitor’s lifetime value.
One example of this is Tele2, a leading Dutch mobile subscription service. They were facing a decreasing subscription rate and wanted to make necessary amendments to uplift it. The team at Tele2 did a detailed analysis and found that adding a filter of mobile brands in the product section can create convenience in the visitor flow. Thus, they ran an A/B with the original page without the filter and variations with it. Here is how it looked:
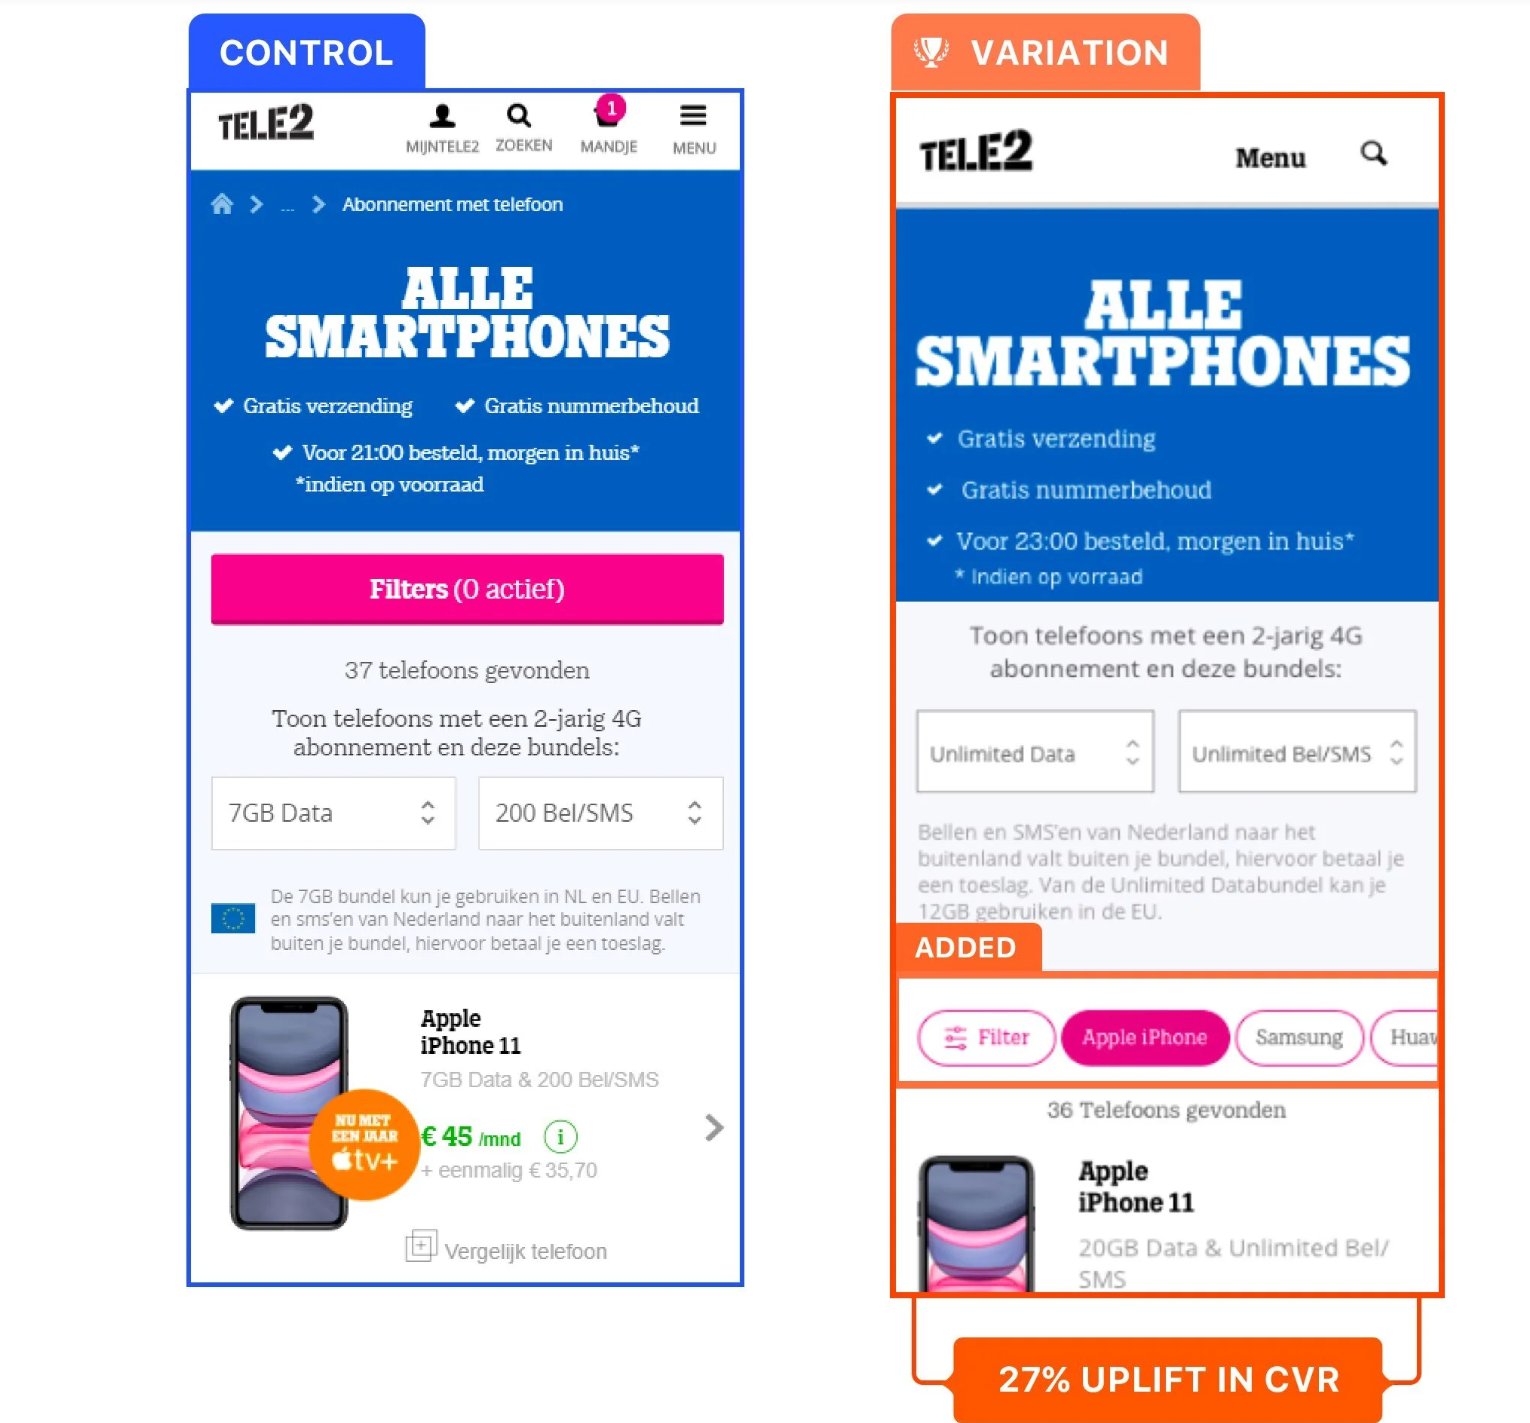
The test ran for 28 days and registered a 27% increase in subscriptions from existing customers. For Tele2, CRO campaigns ensured a positive cash flow from the existing customers. What is more important is that they didn’t stop after one campaign and kept analyzing behavior and experimentation to engage their customers.
In addition, you can run CRO campaigns such as personalized experiences based on past behavior and experiment with cross-selling and upselling tactics to better customer retention rates. Improved retention rates, in turn, result in increased revenue while keeping customer acquisition costs low since fewer resources are needed to onboard new visitors to maintain revenue.
d. Aggregate customer data for hyper-personalized experiences
CRO is now moving towards unifying data from various sources and profiling customers based on it through customer data platforms (CDP). The customer profile can be segmented and targeted for a hyper-personalized experience.
One real-life case study is of Yves Rocher, a global cosmetic brand. Yves Rocher wanted to personalized product recommendations section. The team utilized a CDP to recommend personalized products to new and existing customers. The existing customer got recommendations based on past behavior data, and for new customers, the recommendation algorithm worked on the recent activity.
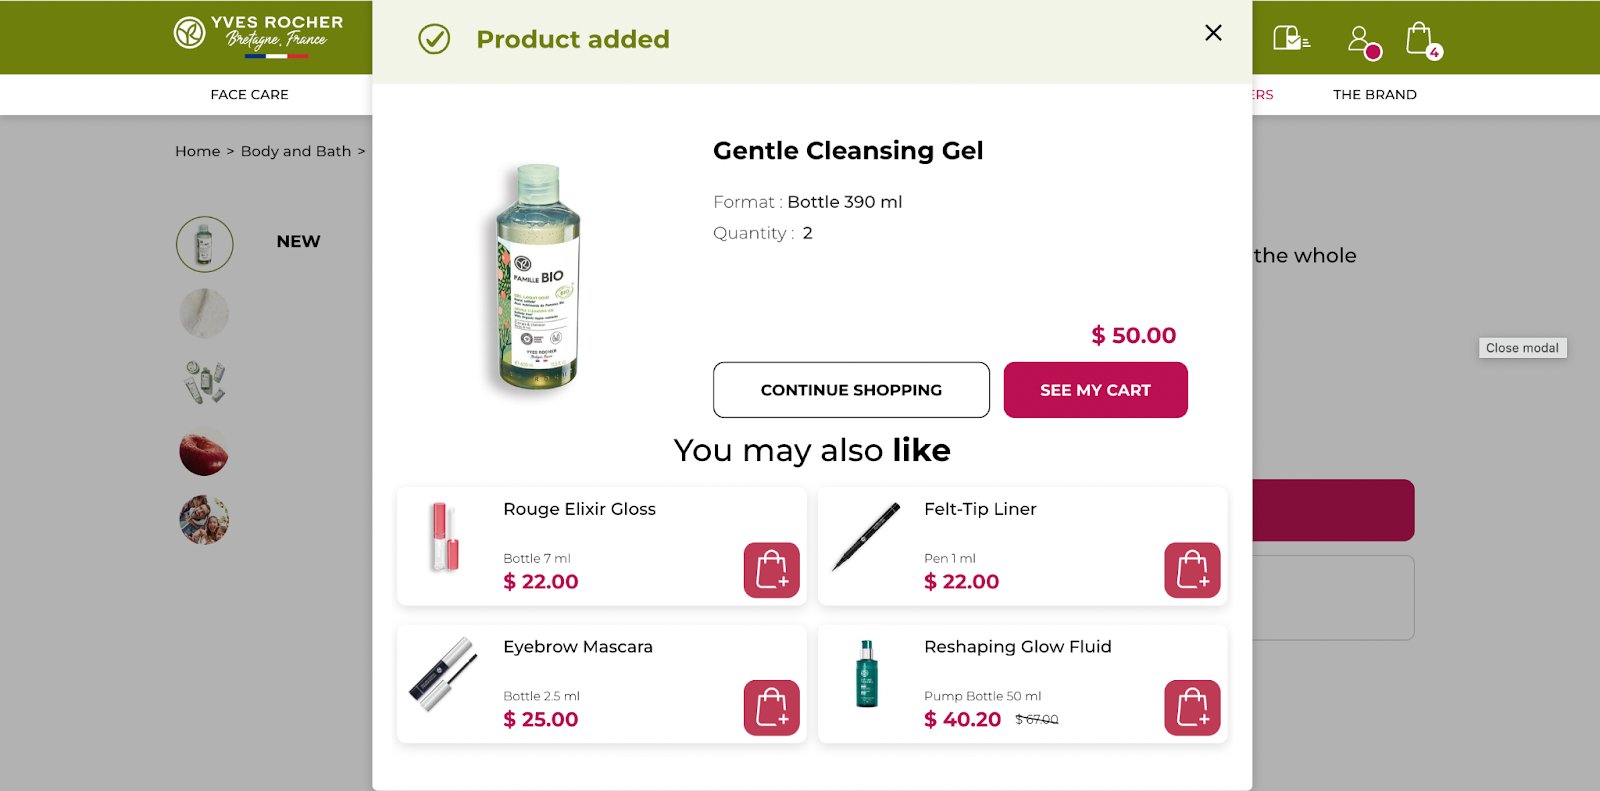
The optimization efforts led to a 17.5x increase in clicks on the recommendation section and an 11x increase in the purchase rate. Thus, CRO efforts get a boost from technological advancement like CDP and become a value center for an organization. So you must leverage this advancement in your favor and move towards creating hyper-personalized experiences to drive more revenue.
Conversion rate optimization with VWO
Over a decade, 2500+ customers have found their value center with VWO.
VWO allows you to understand visitor behavior, experiment with user experience for multiple devices, personalize experiences, and aggregate visitor data for segmentation and targeting. As per G2 Summer 2022 reports, VWO has been named a leader across five categories winning 20 badges.
Once you partner with VWO, you don’t have to go anywhere else for your optimization needs. Here is what one of our clients says:
VWO has been the most comprehensive testing tool I’ve used, and they have the support and services to back it up.
Product manager, Micro Focus
So, multiply your gains with VWO. Get a comprehensive VWO free trial of its complete range of features. VWO also offers a free starter pack for web testing that supports 50,000 monthly traffic. Visit VWO’s plans and pricing to find more information.
Conclusion
CRO (Conversion Rate Optimization) is a value center because it benefits an organization in terms of revenue and directly affects its growth and cash flow.
CRO increases revenue by optimizing each stage of the visitor journey, from the landing page to the checkout page. It also turns failures into information that can be used to improve future optimization efforts. With constant CRO efforts, an organization can increase its revenue, keep customer acquisition costs low, and create a positive cash flow from its existing customers.
Therefore, CRO should be considered an essential investment, and organizations should engage in constant CRO efforts to reap long-term benefits.
]]>You can see that advanced technology did not come out of the blue. It evolved with one advancement becoming the foundation for another.
For instance, the smartphone industry stands on the foundation of numerous technological breakthroughs. From the initial landline telephones, the concept of cordless phones emerged, followed by the integration of mobile communication with computing power.
Over time, we witnessed an evolution from personal digital assistants, such as BlackBerry devices, to the advent of the iPhone, which paved the way for the smartphone industry.
It’s like a loop, where each advancement created new opportunities that, in turn, lead to further progress. The loop has revolutionized our technology because we never left a loose end after an advancement.
What if we followed the same approach toward experimentation on digital properties?
Experimentation can sometimes lift your conversion rate beyond expectations and at times drop even for a promising hypothesis. It’s part and parcel of the process.
But if you stick to a linear approach of closing the test after getting results and move on to test something new, it will rarely give you breakthroughs. You’ll miss out on chances to improve conversion rates and overlook valuable insights for future success. In the best-case scenario, it will plateau your growth rate.
That is why it’s time to move on from the linear approach and take a strategic approach with the Experimentation Loop to realize the true conversion potential of your websites and mobile apps.
But what is an Experimentation loop? Let’s delve into this fascinating concept.

What is an Experimentation Loop?
An Experimentation Loop starts with identifying a problem through behavior analysis and creating a solution in the form of a hypothesis. Then, you run experiments to test the hypothesis. You either win or lose, but with a linear approach, you stop the experimentation cycle here. But with the Experimentation Loop, you investigate the test results to uncover valuable insights. The uncovered insights can derive new hypotheses, which lead to further experiments, creating a continuous cycle of learning and optimization.
Here’s a visual illustration of how the Experimentation Loop works:
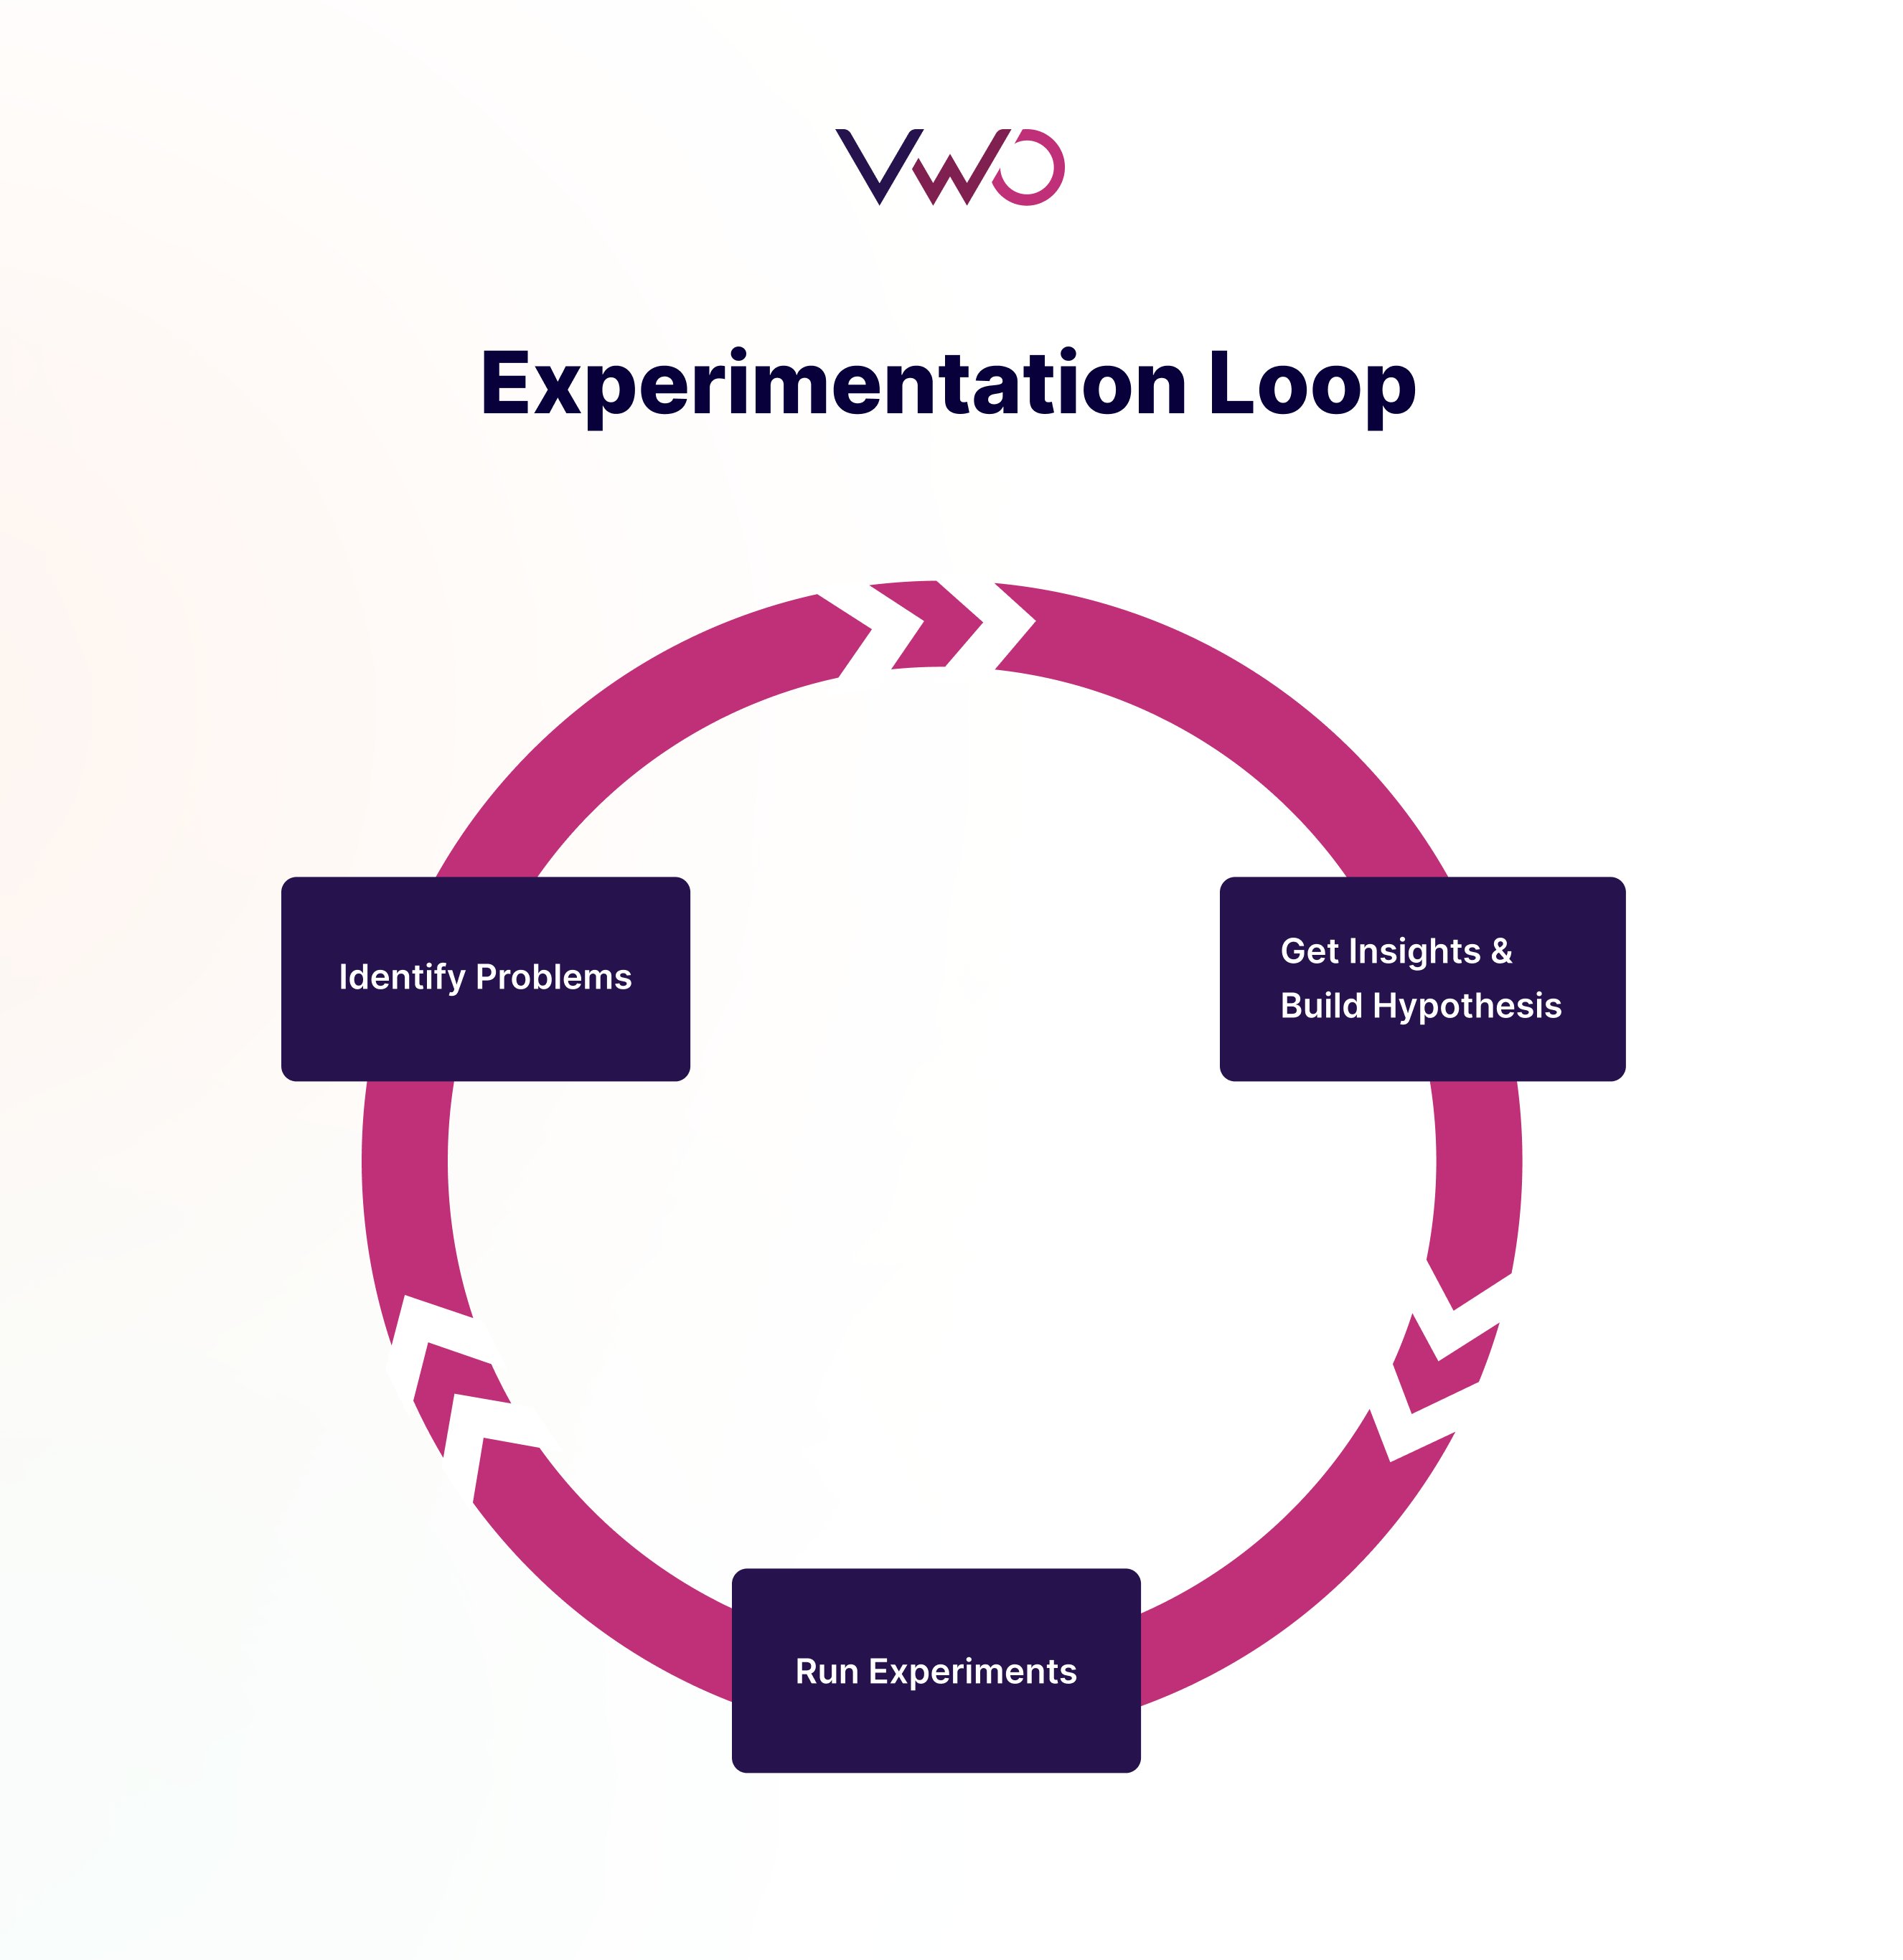
With Experimentation Loops, you are not just stopping at the results but diving deeper to understand the reasons behind the results, identifying anomalies, and discovering if particular audiences (or participants of the experiment) react differently from others. This becomes the foundation for your new hypothesis and experiments.
It is especially critical in today’s ever-changing digital landscape, where user behavior is constantly evolving. By embracing the continuous learning and optimization provided by Experimentation Loops, you can stay ahead of the curve and keep improving your conversion rate.
Understanding the Experimentation Loop with an example
Here is a hypothetical example that explains how the Experimentation Loop functions:
Consider a landing page created with the intent to generate leads. The original version of the page has a description of the offering in the first fold, followed by the call-to-action (CTA) button that will lead to the contact form.
Let’s say that the behavioral analysis of the landing page reveals many visitors dropping off on the first fold. This leads to the hypothesis of adding a CTA above the fold to improve engagement. This way, you create an A/B test to compare the original version and the variation with additional CTA above the fold.
Here is the visual representation of the original and the variation of the landing page:
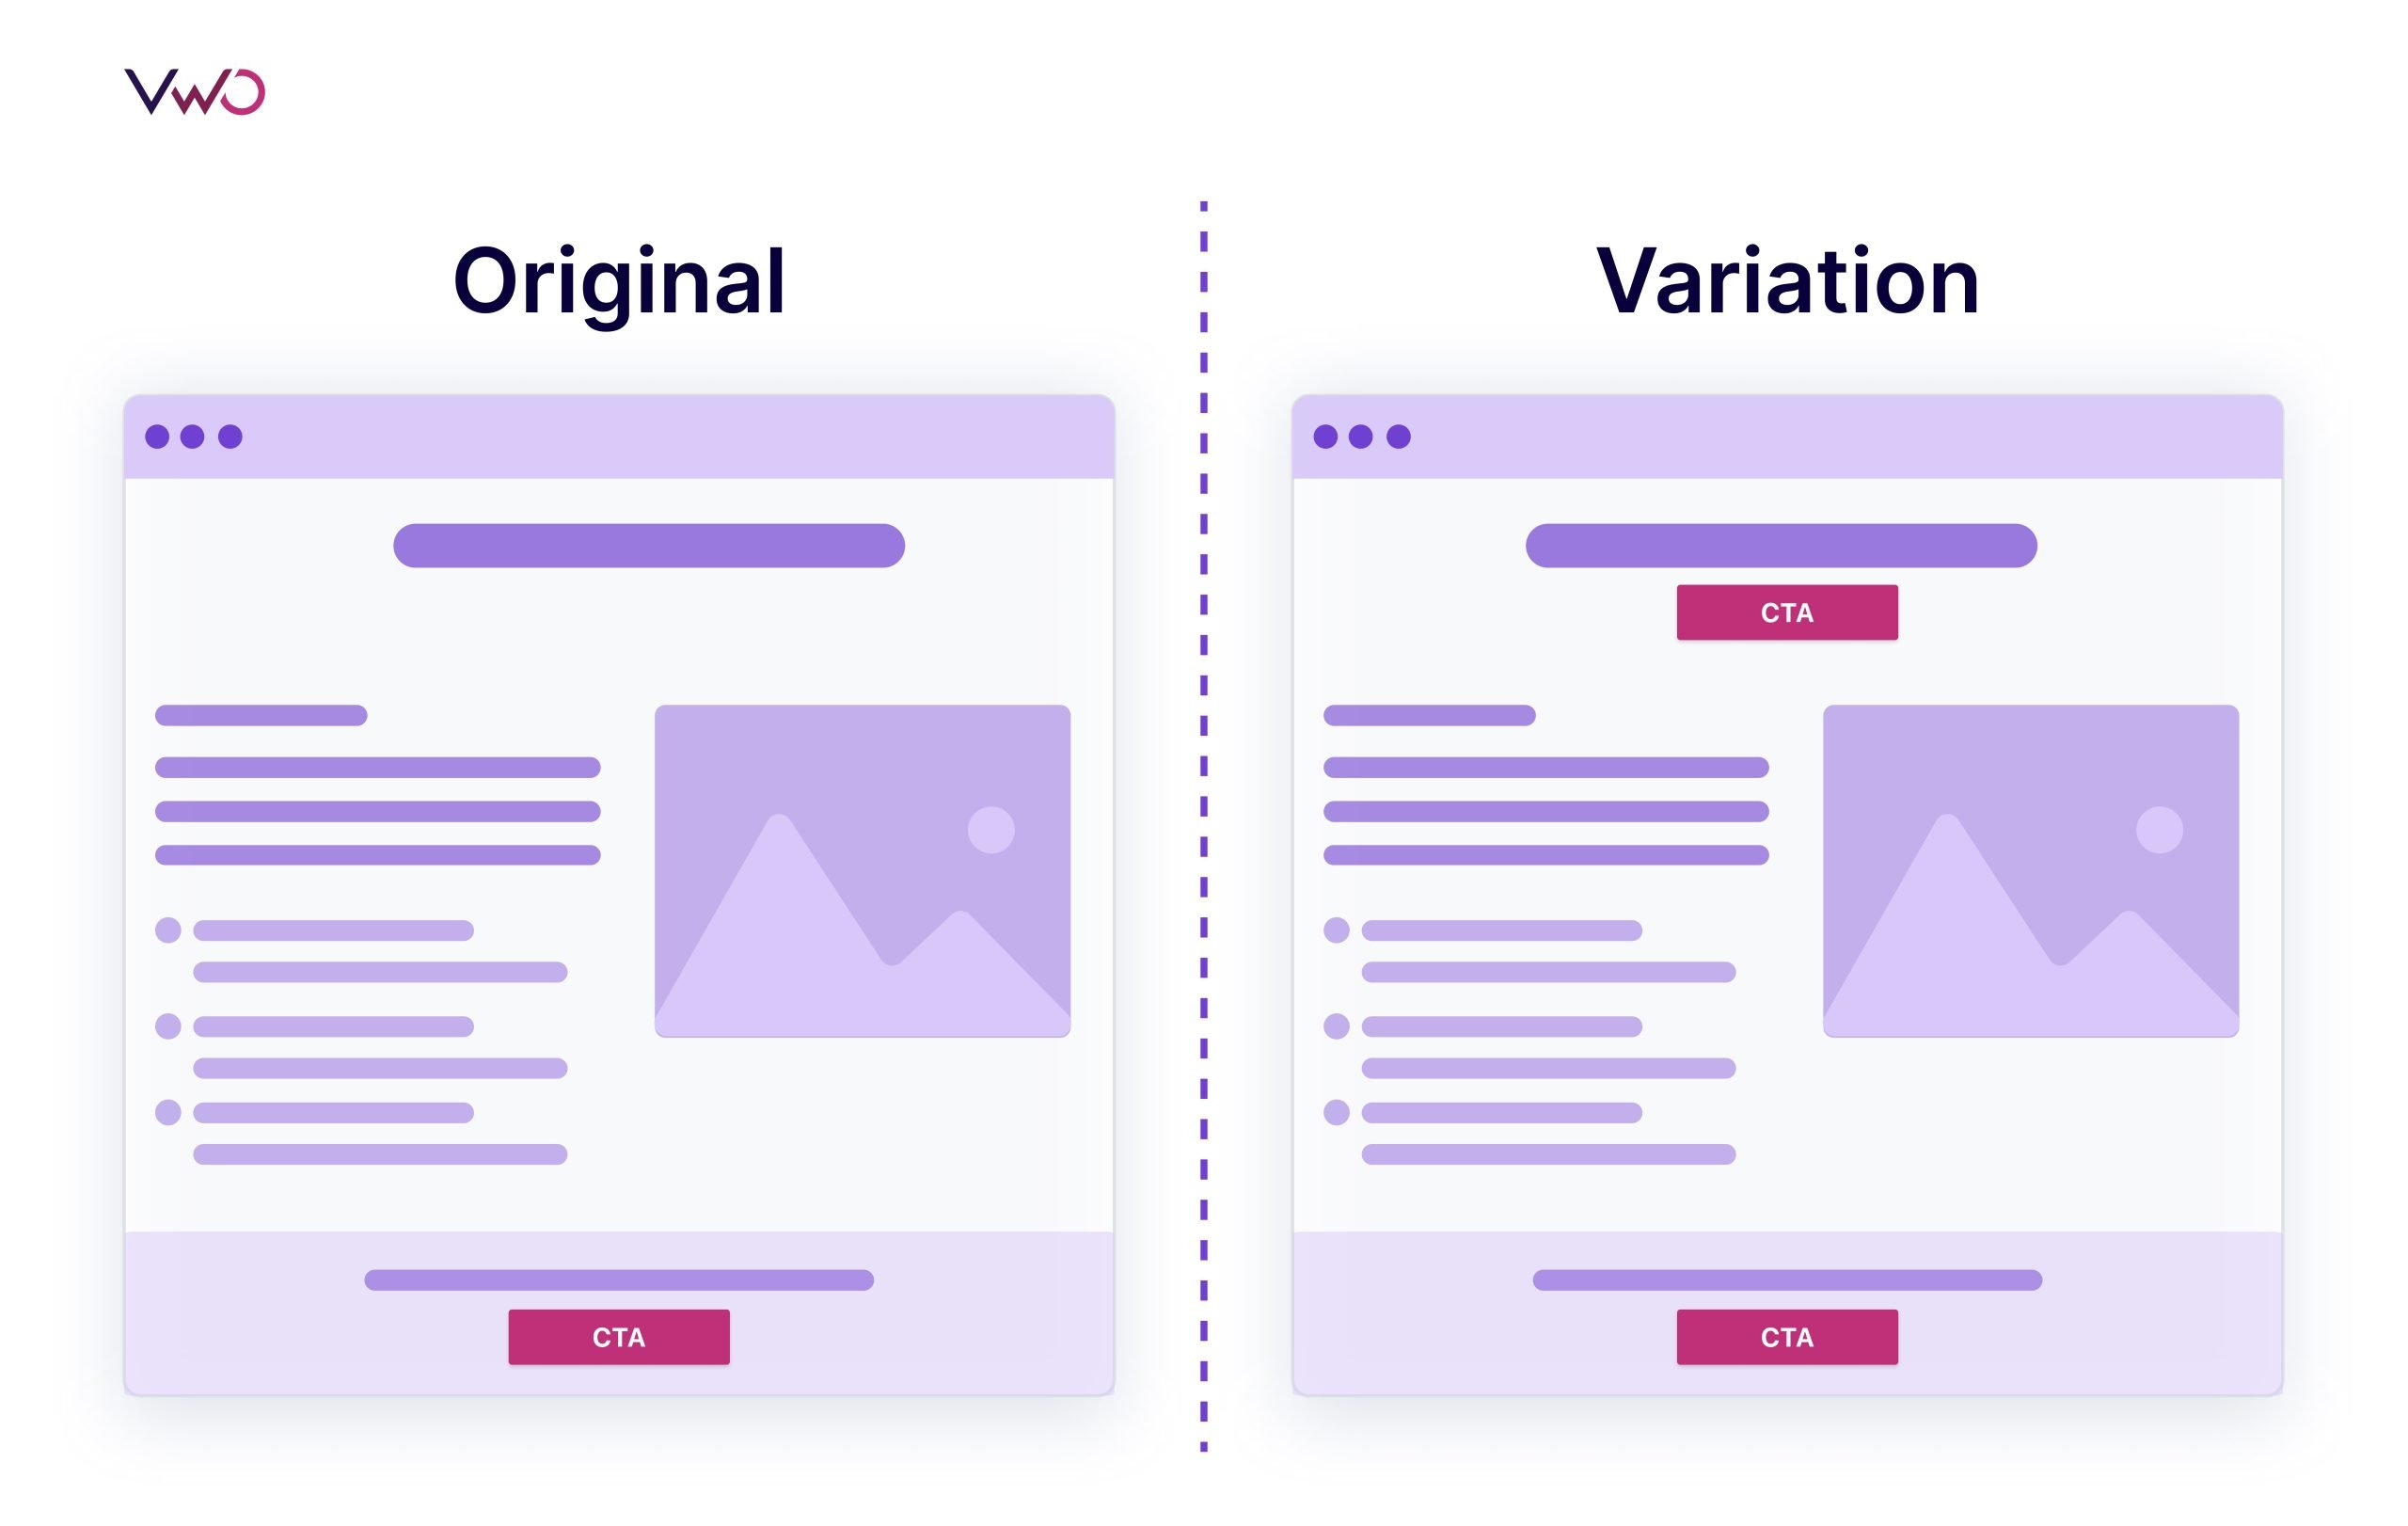
Let’s assume that the test ends with the variation outperforming the original in terms of the conversion rate (i.e. number of clicks on the CTA). Here, the traditional approach concludes the test. But with the experimentation loop, we will try to analyze the results to come up with more hypotheses and open up multiple opportunities for improvement.
Suppose, we zero down on the hypothesis that demands testing the CTA button. Then, the second round will involve coming up with multiple variations of the CTA text and CTA color to optimize the button. Here, to find out the best variation, we can run a multivariate test to compare the original version and multiple variations with different combinations.
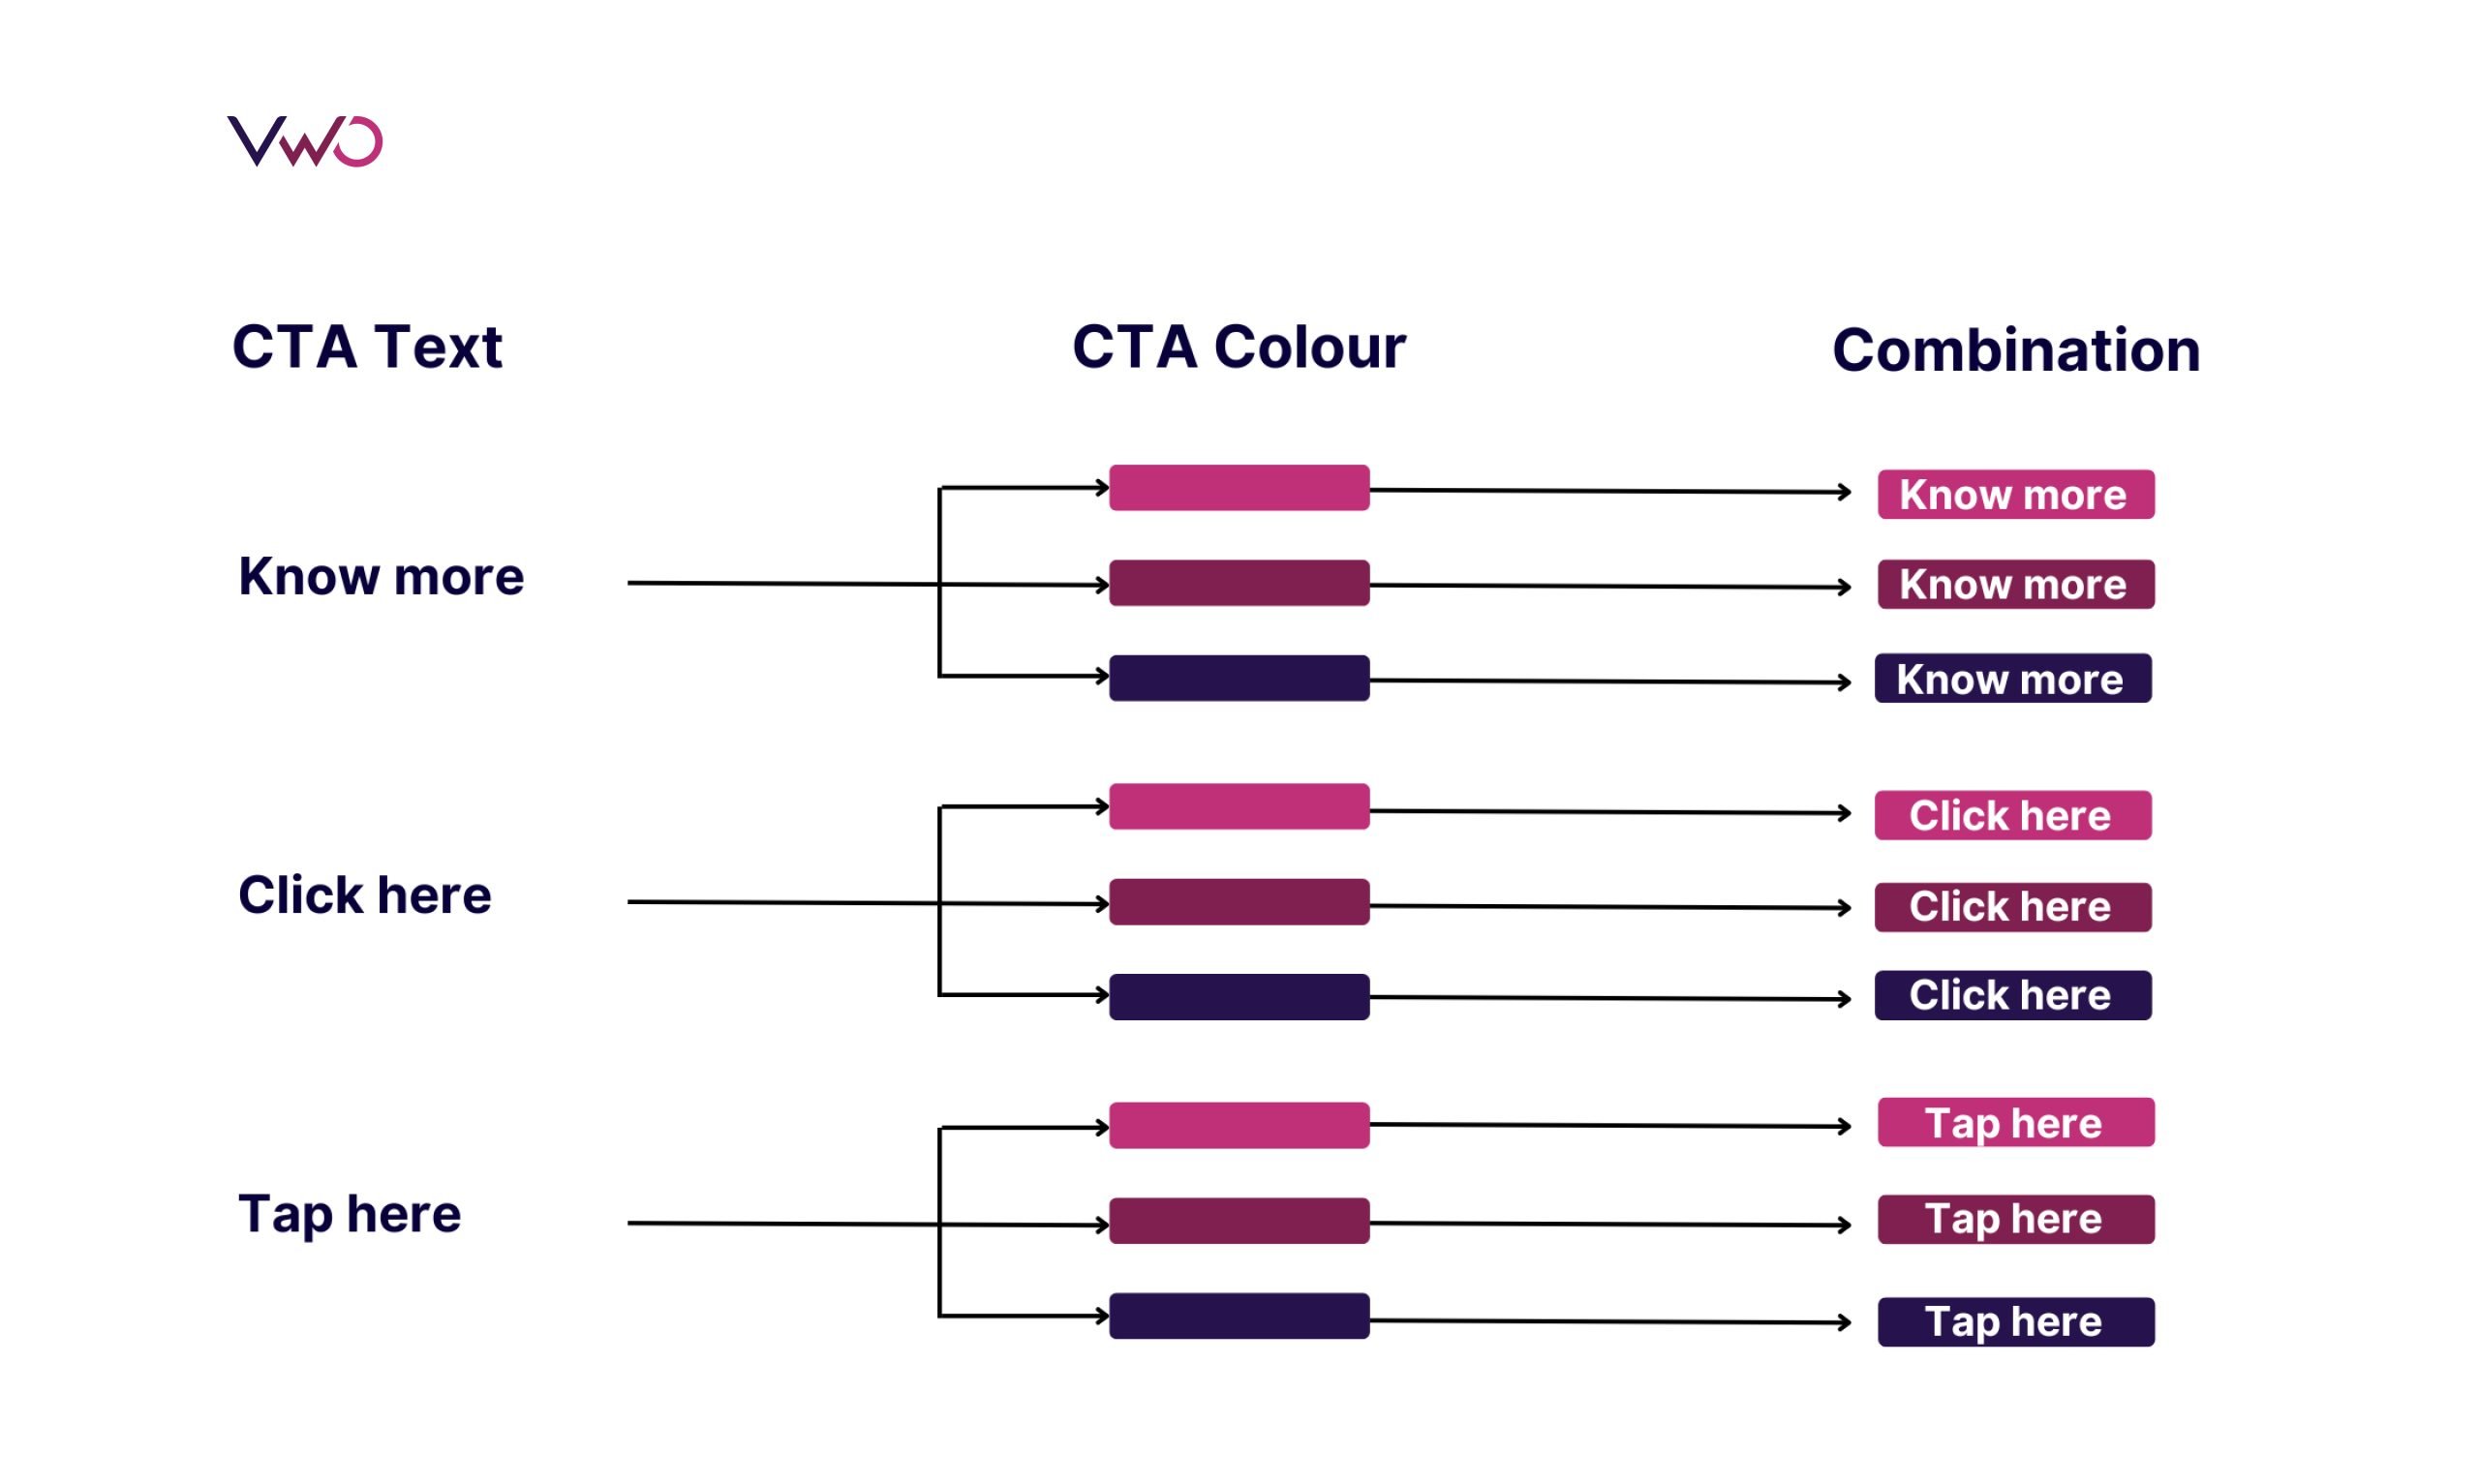
At the end of the test, there can be an uplift in conversion, which would have not been possible with the traditional approach. And if the test fails to get an uplift in conversion rate, it will lead to insights that can help in knowing more about the users.
Likewise, we can check the results to know if a particular audience segment engaged with the button more than others (and if they have common attributes) – in which case, it could lead to a hypothesis for a personalization campaign that includes personalizing the headings or subheading before the CTA as per behavior, demographic, or geographic attributes of the segment.
Thus, an Experimentation Loop opens up the opportunity to improve, which is not possible with a siloed and linear approach.
But how can you carry out the successful execution of the Experimentation Loop?
The experimentation loop consists of three steps, and we will delve into each of these steps in the upcoming section.
Three steps in the Experimentation Loop
Following are the three key steps in the Experimentation Loop for improving conversions.
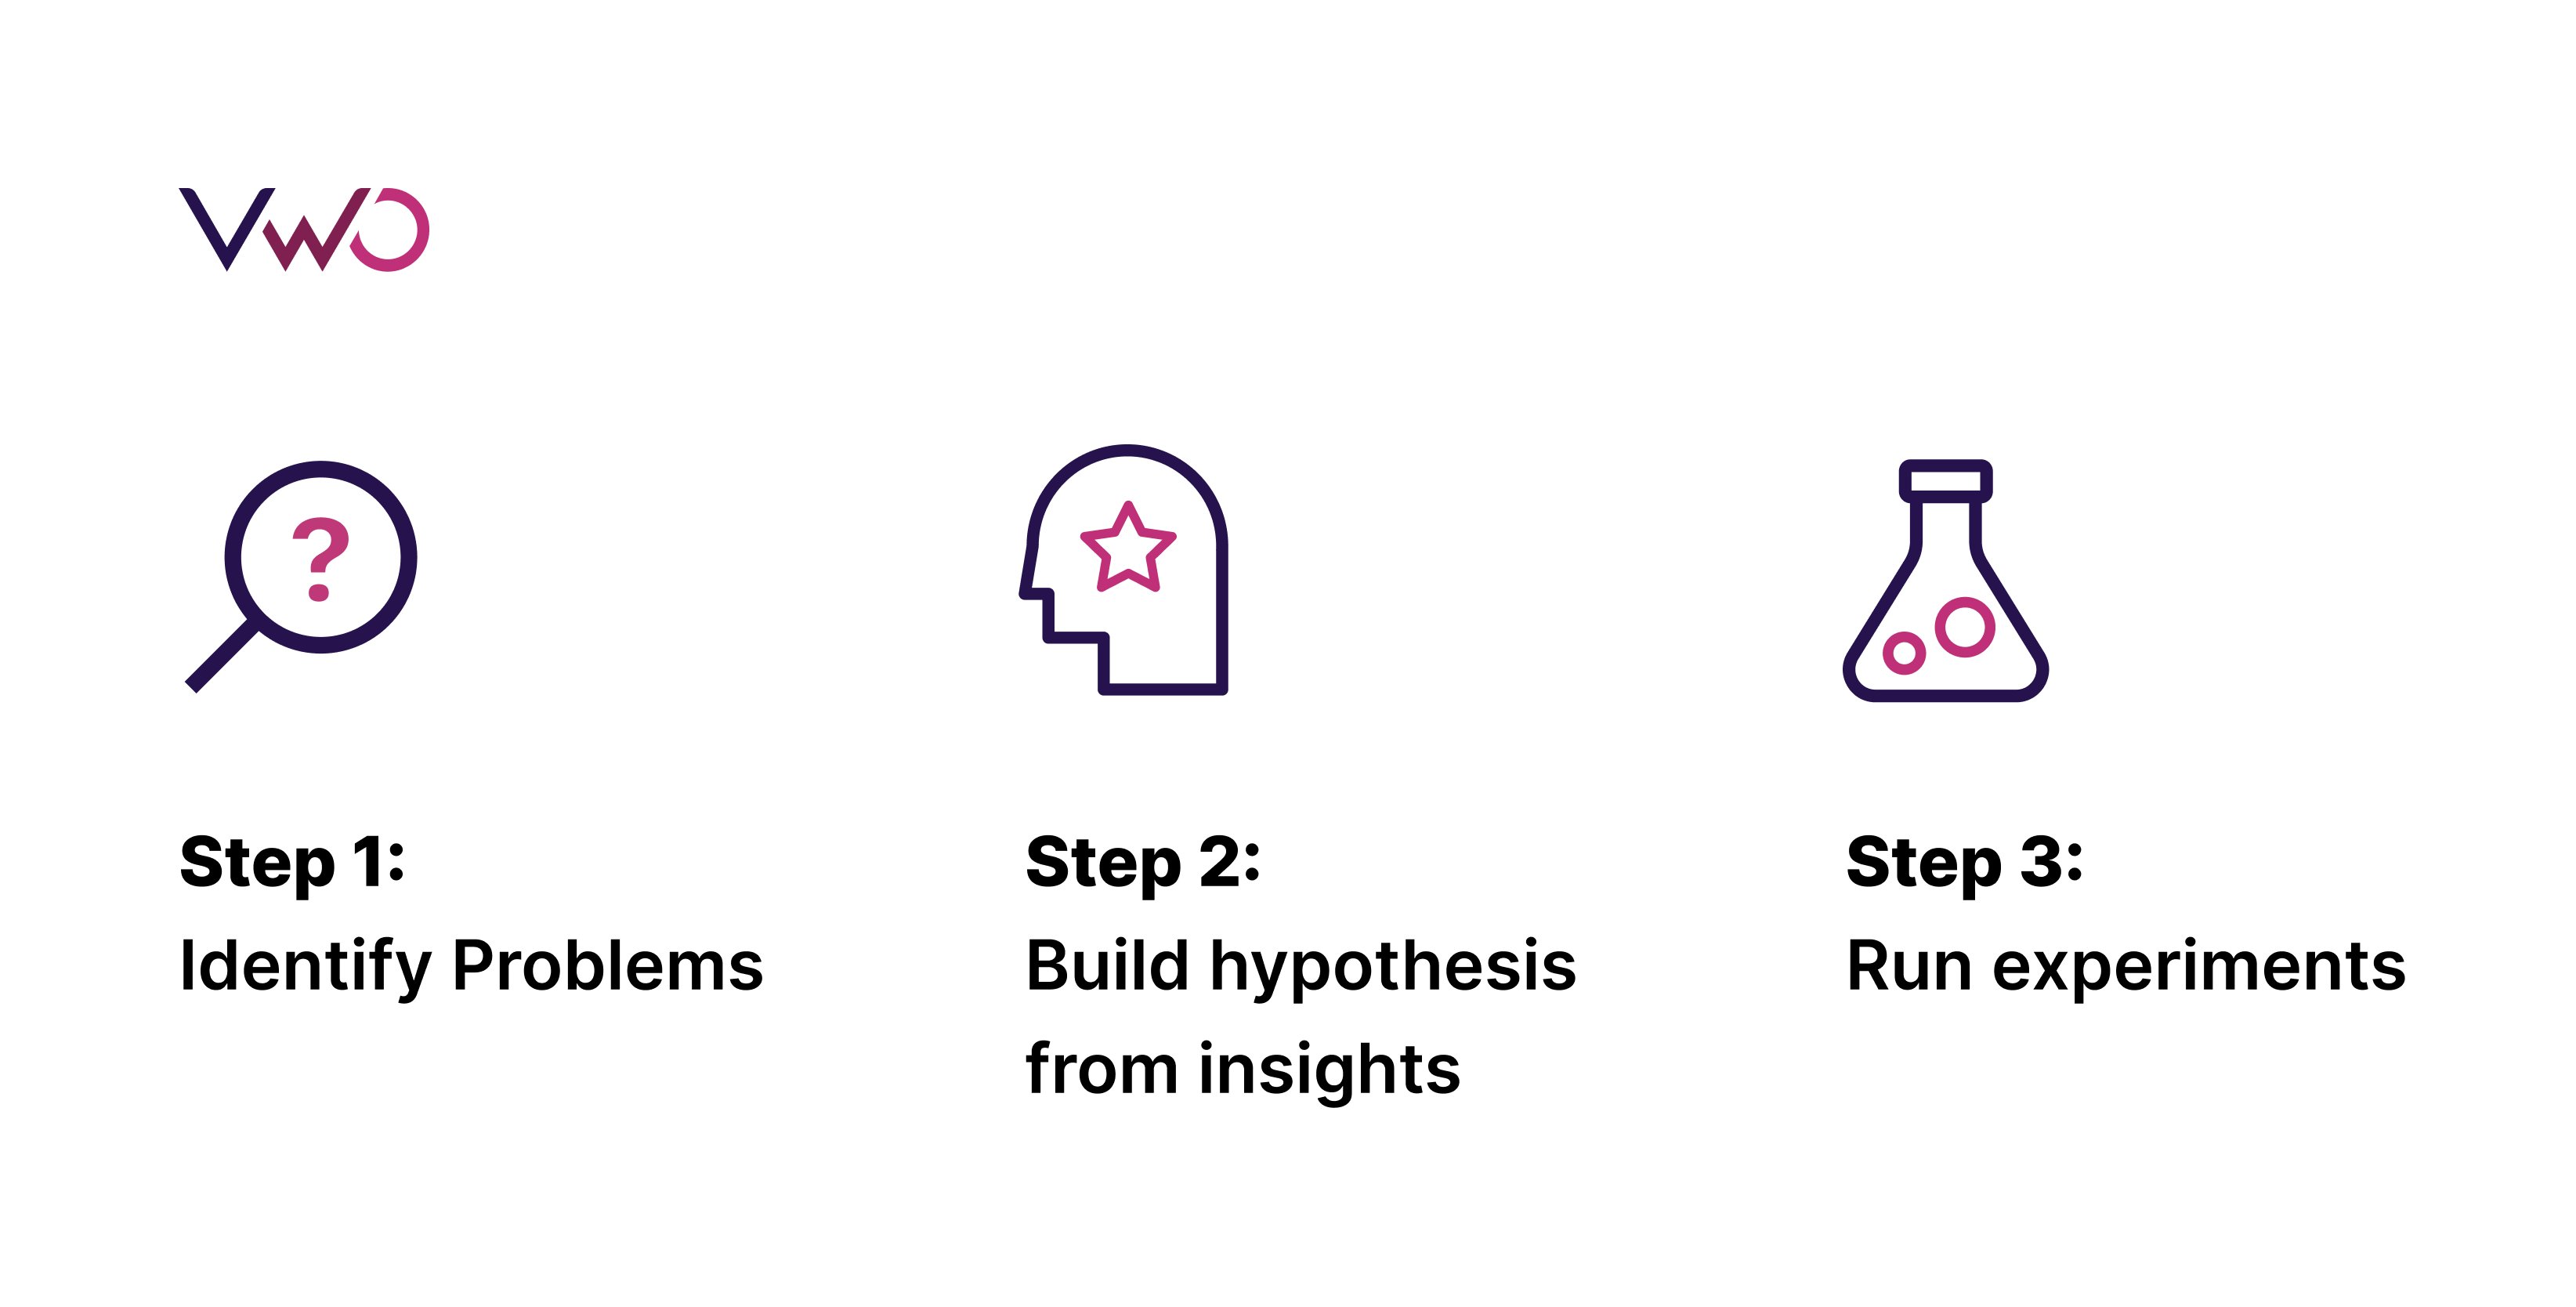
Step 1: Identify problems
The Experimentation Loop starts with identifying the existing problem in user experience. First, you do a quantitative analysis that involves going through key metrics like conversion rate, bounce rate, and page views to identify the low-performing pages on the user journey.
Once you zero down on the weak links, you can do a qualitative analysis to understand the pain points. You can check session recordings and heatmaps to know the performance of each element that affects the conversion rate.
Once you identify the problem associated with the elements, it can help draft a hypothesis.
Step 2: Build hypothesis from insights
After identifying elements that are affecting the conversion negatively, you can start digging into the insight data to make sense of it.
For example, you identified the banner image position as the reason for the high bounce rate of the blog after all the quantitative and qualitative analyses. Then you can build a hypothesis about the position of this image that offers a solution for the high bounce rate.
While framing the hypothesis, you should specify the key performance indicator (KPI) to be measured, the expected uplift, and the element to test.
Next, you move forward to run the experiment.
Step 3: Run experiments
Based on the hypothesis, you choose from tests like the A/B test, multivariate test, split URL, and multipage test. You run it till the test reaches a statistical significance.
The test may result in a change in the conversion rate, and the insights about the user behavior toward the new experience can open doors to identify areas for the second cycle of the experimentation.
Thus, the Experimentation Loop will constantly carve a path to improve conversion.
Experimentation Loop and sales funnel
Running Experimentation Loops at every stage of the funnel can substantially improve the conversion rate and provide a strategic framework for testing hypotheses rather than a haphazard approach.
To enhance the conversion rate of the same element, you can run an Experimentation Loop, as seen in the example of A/B testing to Multivariate testing.
Alternatively, you can analyze the insights from a test that improved a metric to see how it affected other metrics, which could lead to the second cycle of the test.
For instance, let’s take the awareness stage. The goal in this stage is to attract users and introduce them to products or services on a digital platform.
Suppose you ran an A/B test on search ads to get more users to the website and monitored metrics like the number of visitors.
Let’s say the test led to an improvement in traffic. Now, you can move on to analyze other metrics, such as % scroll depth and bounce rate for the landing page, and identify areas for improvement. To pinpoint the specific areas where users are leaving, you can use tools such as scroll maps, heat maps, and session recordings. The analysis can lead you to create hypotheses for the second leg of the experiment. It could involve improving user engagement by testing a visual element or a catchy headline.
Likewise, running the Experimentation Loop at other stages of the funnel can optimize the micro journey that the customer takes at each funnel stage. Moreover, the Experimentation Loop can lead to hypotheses creation from one funnel stage to another, resulting in a seamless experience that is hard to achieve with a siloed approach.
How Frictionless Commerce uses Experimentation Loops for conversion copywriting
Frictionless Commerce, a digital agency, has relied on VWO for over ten years to conduct A/B testing on new buyer journeys. They have established a system where they build new experiments based on their previous learnings. Through iterative experimentation, they have identified nine psychological drivers that impact first-time buyer decisions.
Recently, they worked with a client in the shampoo bar industry, where they created a landing page copy that incorporated all nine drivers. After running the test for five weeks, they saw an increase of 5.97% in conversion rate resulting in 2778 new orders.
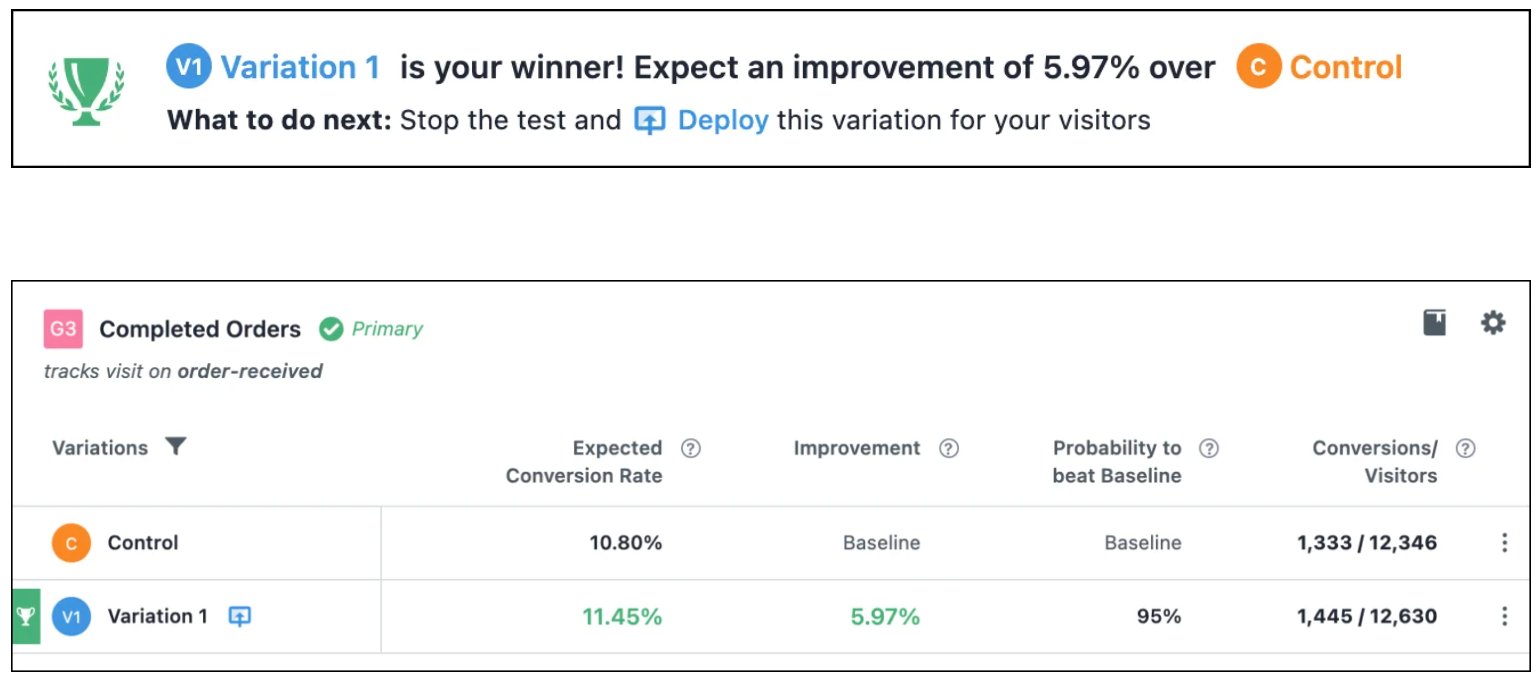
It just shows how Experimentation Loops can bring valuable insights and take your user experience to the next level.
You can learn more about Frictionless Commerce’s experimentation process in their case study.
Conclusion
Embracing the continuous learning and optimization provided by Experimentation Loops is crucial for businesses looking to stay ahead of the curve and improve their conversion rates.
To truly drive success from your digital property, it’s time to break the linear mold and embrace the Experimentation Loop. By using a strategic framework for testing hypotheses, rather than a haphazard approach, businesses can continuously optimize and improve their digital offerings.
You can create Experimentation Loops using VWO, the world’s leading experimentation platform. VWO offers free testing for up to 5000 monthly tracked users. Visit our plans and pricing page now for more information.
]]>
We are beyond delighted with your unwavering love for our content. Your support has enabled us to reach so many audiences, and we couldn’t have done it without you. We’ve been working hard to keep up with your demand to see more of our content, and we’re thrilled to announce something new and exciting – our very own VWO Podcast. 

Podcasting is a fun and interesting space where you can enjoy any content of your choice anytime and anywhere. So, let’s say you’re in a rush to pick up your kid from school, but you also want to utilize the time to learn about data-driven personalization. You don’t really have to choose between the two. Tune into the relevant podcast episode and gain some valuable insights on the go. Also, we know that everyone learns differently, and some of us just absorb information better when we’re listening. All in all, our objective is to make the process of acquiring information or knowledge easy and fun for our audiences.
We spent a lot of time curating VWO Podcast for you, featuring exclusive episodes with industry leaders who will share their knowledge and insights about everything related to conversion optimization, UX, experimentation, data analytics, and so on.
So, who are the top industry leaders on our podcast?
Darrell Williams – Darrell Williams On Using Hick’s Law To Drive CRO Success
Currently serving as the Head of Insights and Optimizations, Darrell has several years of experience as a growth marketing expert with special focus on CRO, SEO, and analytics. In one of our episodes, you’ll hear the expert shedding light on the perils of offering too many choices to your customers and overcoming this problem by leveraging feedback & prioritizing products/services.
Chris Marsh – How Chris Marsh Added +$3M to Client Revenue With CRO & UX
Chris Marsh is an independent CRO consultant who shines bright in the CRO community on LinkedIn, offering his thoughtful suggestions and tips for audiences. You’ll hear the expert talk about how he added +3M to client revenue using the right approach toward CRO. Want to replicate his success? Well, Chris says it’s not simple or easy, but it’s not impossible either. Just have the right approach and give this episode a listen.
Brian Massey – Brian Massey On How Data Has CHANGED The Way We Design
With 15 years of experience under his belt, Brian Massey is the conversion scientist you must listen to if you want to take a scientific approach to conversion rate optimization for maximum results. He says the design process is getting smarter. Marketers no longer exhaust budgets and then analyze if it was money well-spent. So, what do they do instead? This is why he discusses how data can improve design and boost ROI.
Julia Ritter – Julia Ritter on How To CONVERT Users From Email Campaigns
Having worked as the Email Marketing Manager at Mailjet by Sinch, Julia Ritter loves sending out emails and measuring their performance. Julia drops a bomb that people usually receive up to 50 emails per day! How do you make sure they open and read yours? Join Julia as she shares the do’s and don’ts of email campaigns along with actionable strategies to improve email open rate and click rate.
Our lineup of industry experts doesn’t end here! But for now, we’ll leave you with a taste of what’s to come. Want to discover more? Subscribe to our podcast and join us on this exciting journey! 
Here’s where you can listen to our podcast
Our podcast will be available on Spotify in video format and on other streaming platforms like Apple Podcasts, and Google Podcasts in audio form. We’ll be releasing a new episode every Wednesday. Make sure you hit the follow button on Spotify so you’ll be notified when a new episode is out.
Spread the word!
We’re excited to share our VWO Podcast with you and hope you’ll enjoy listening to it as much as we enjoy creating it. If you find it helpful and informative, do share it within your network. We want to help as many people as we can.
Your feedback is important to us, and we’d love to hear from you. So, go ahead and tune into our first podcast episode. Enjoy listening! We’ll catch up with you soon. Until then, keep listening and stay tuned!
]]>Types of mobile app experiments you can try
Let’s look at the top four experiments that impact app user experience significantly and show, using real-world examples, how you can try them out in VWO.
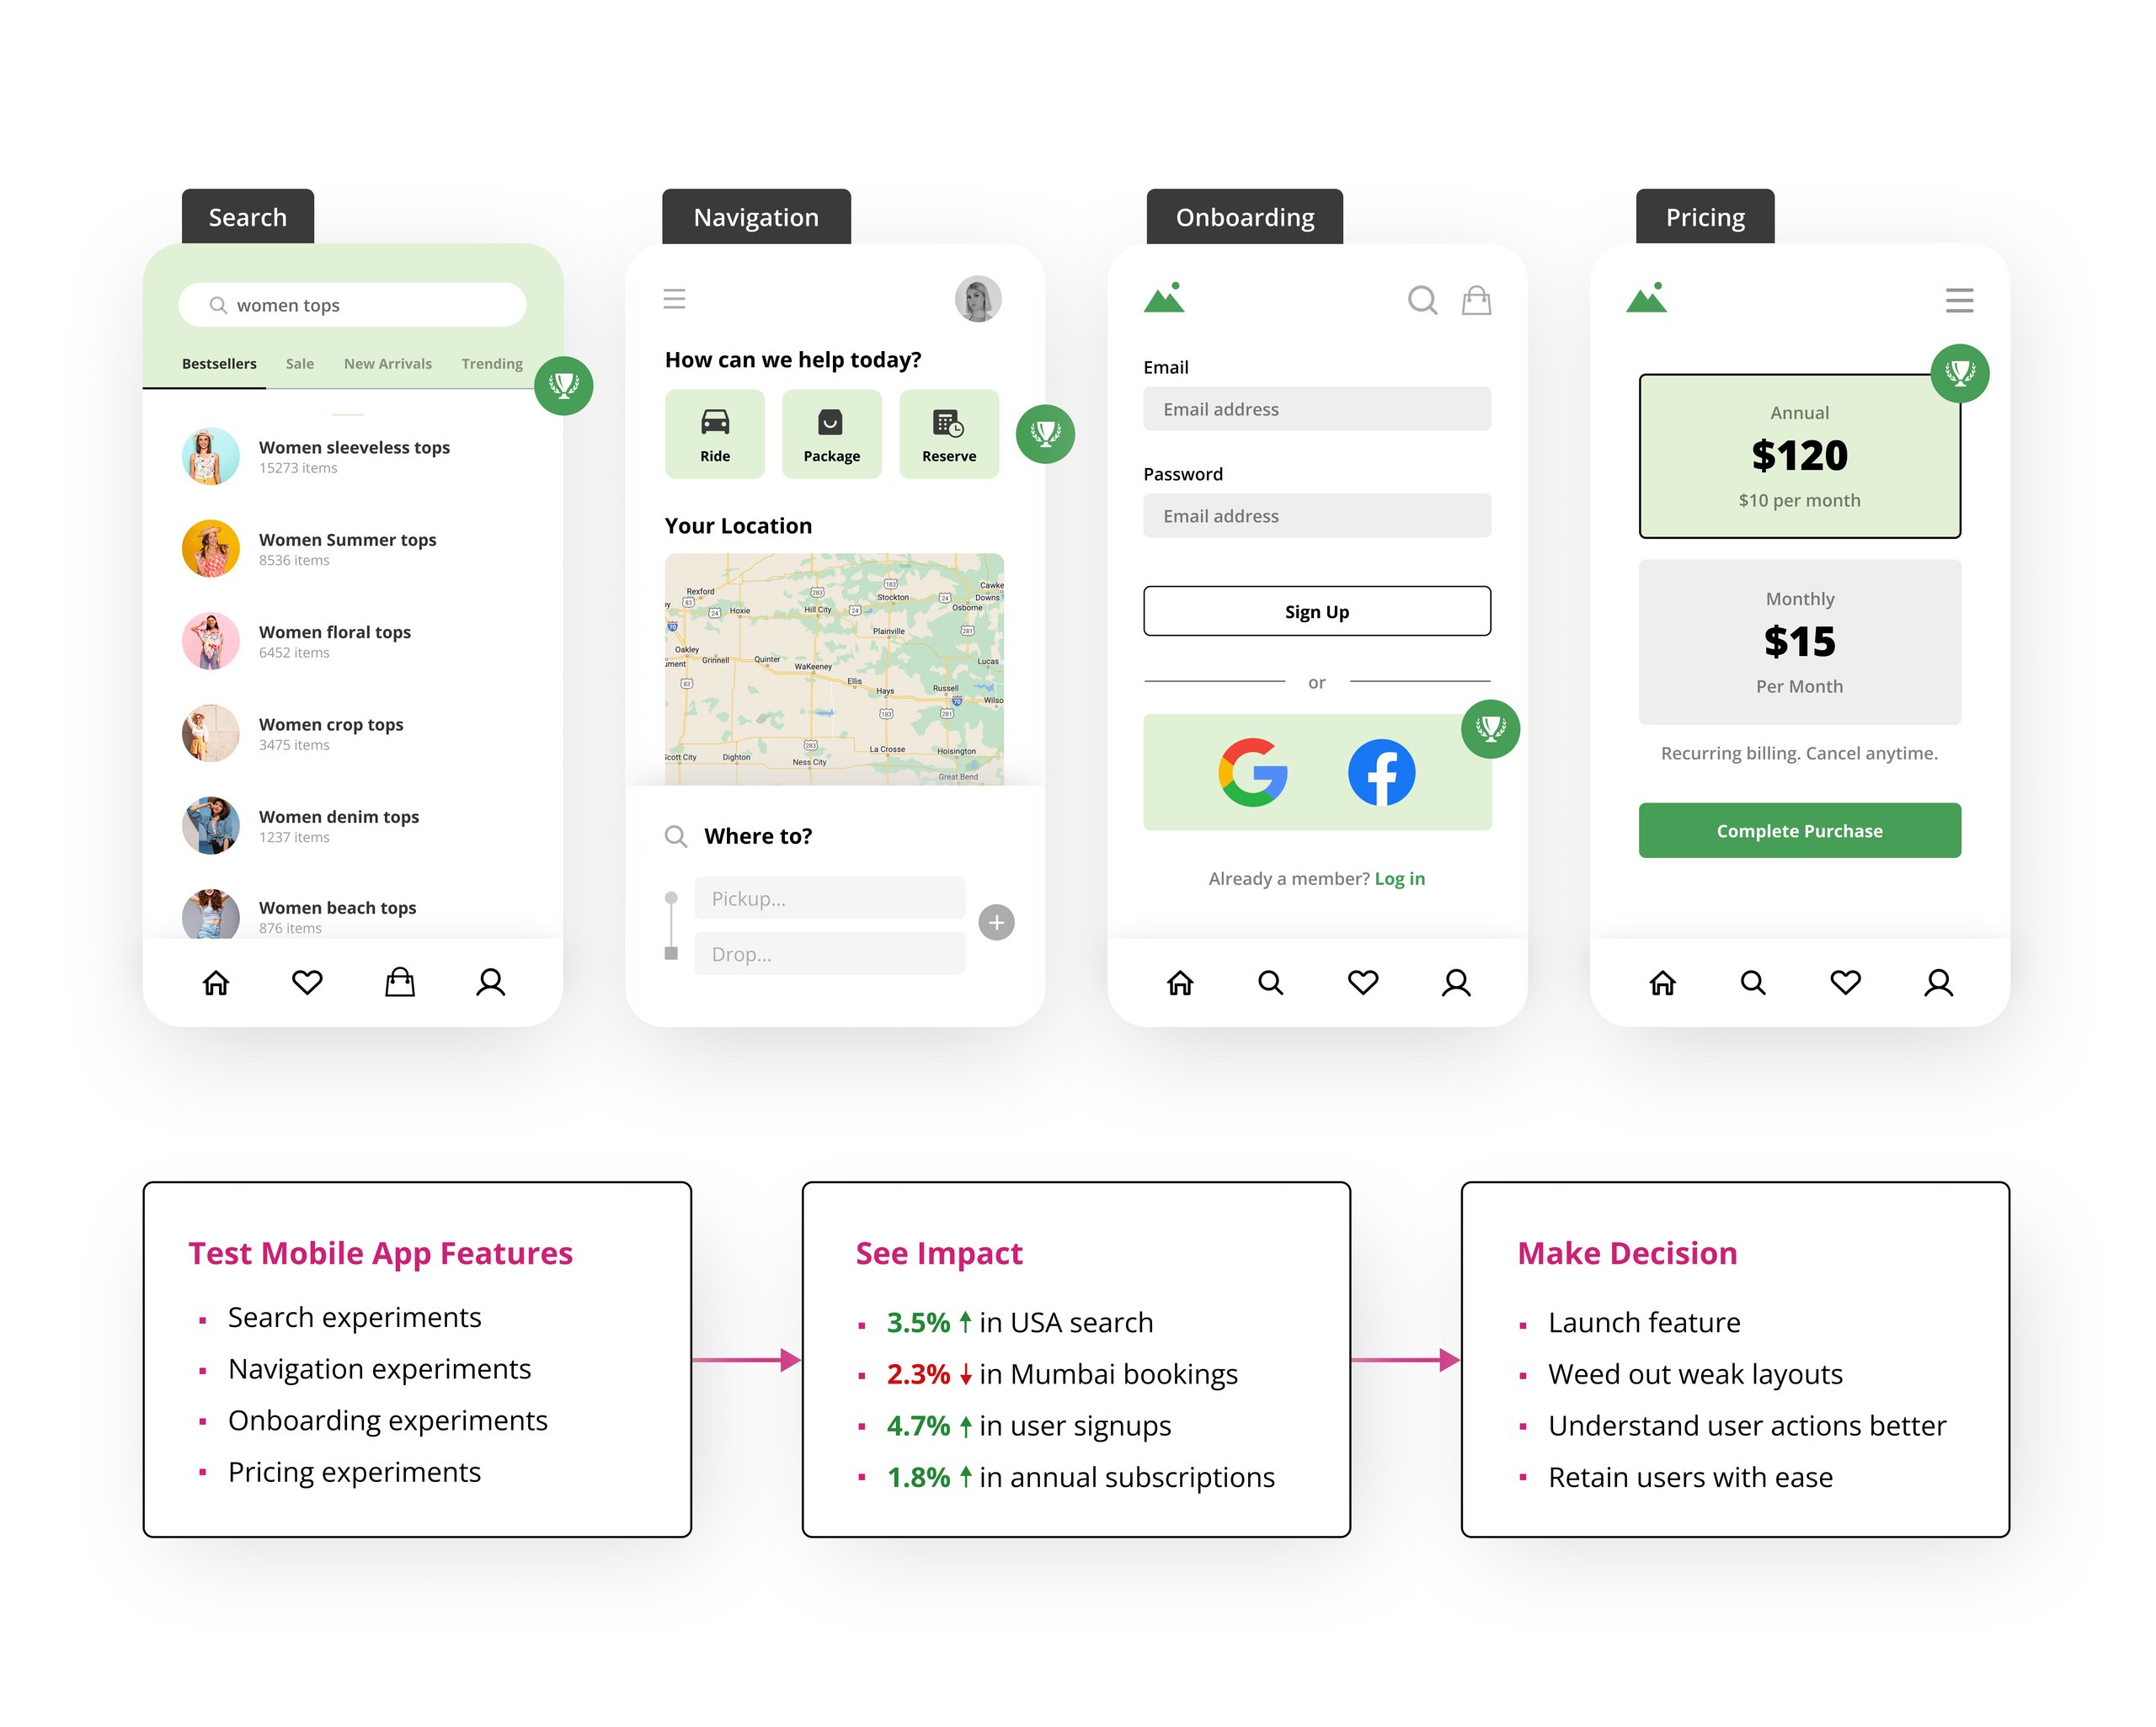
1. Search experiments
Users with shorter attention spans are easily distracted and may not take action if there are too many obstacles. Given the limited screen space on mobile devices, it is not practical to include an extensive menu or a variety of filters to aid navigation within the app. Therefore, incorporating and optimizing search functionality becomes necessary to improve product or feature visibility and ensure proper showcasing for mobile apps.
Metrics to track
Assuming you’re already considering optimizing your app search, here are some metrics to keep a close eye on:
- Search exit rate
- No. of users selecting the item shown in the search
- No. of searches with no results
These metrics can be defined easily in VWO. Insights drawn from this data will give you a clear understanding of where your app’s search performance currently stands and where it is lagging.
Deep-dive into user insights with qualitative behavior research
To provide more depth to your observations, supplementing quantitative data with qualitative research can prove valuable. Heatmaps are widely used (and loved) for this, and for a good reason. Say you see a dip in the number of clicks on the search results. There could be a few reasons why:
- The search results are not relevant
- The results order is not personalized
- The number of items displayed after the search is too low
VWO’s upcoming Mobile Insights product makes it easy to leverage session recordings and heatmaps or scroll-maps to delve deeper into user behavior and identify what needs to be optimized. With VWO Mobile Insights, you can find answers to questions like:
- How are visitors using the search function? (e.g., to look for categories vs. pointed specific products)
- Is auto-complete impacting conversion?
- Is surfacing their search history effective in improving sales for previously purchased items?
- What is causing friction in their search experience?
Examples that you can try
You can formulate and validate hypotheses through A/B tests based on your observations.
If you are wondering where to start, here are a few real-world examples you can refer to for inspiration.
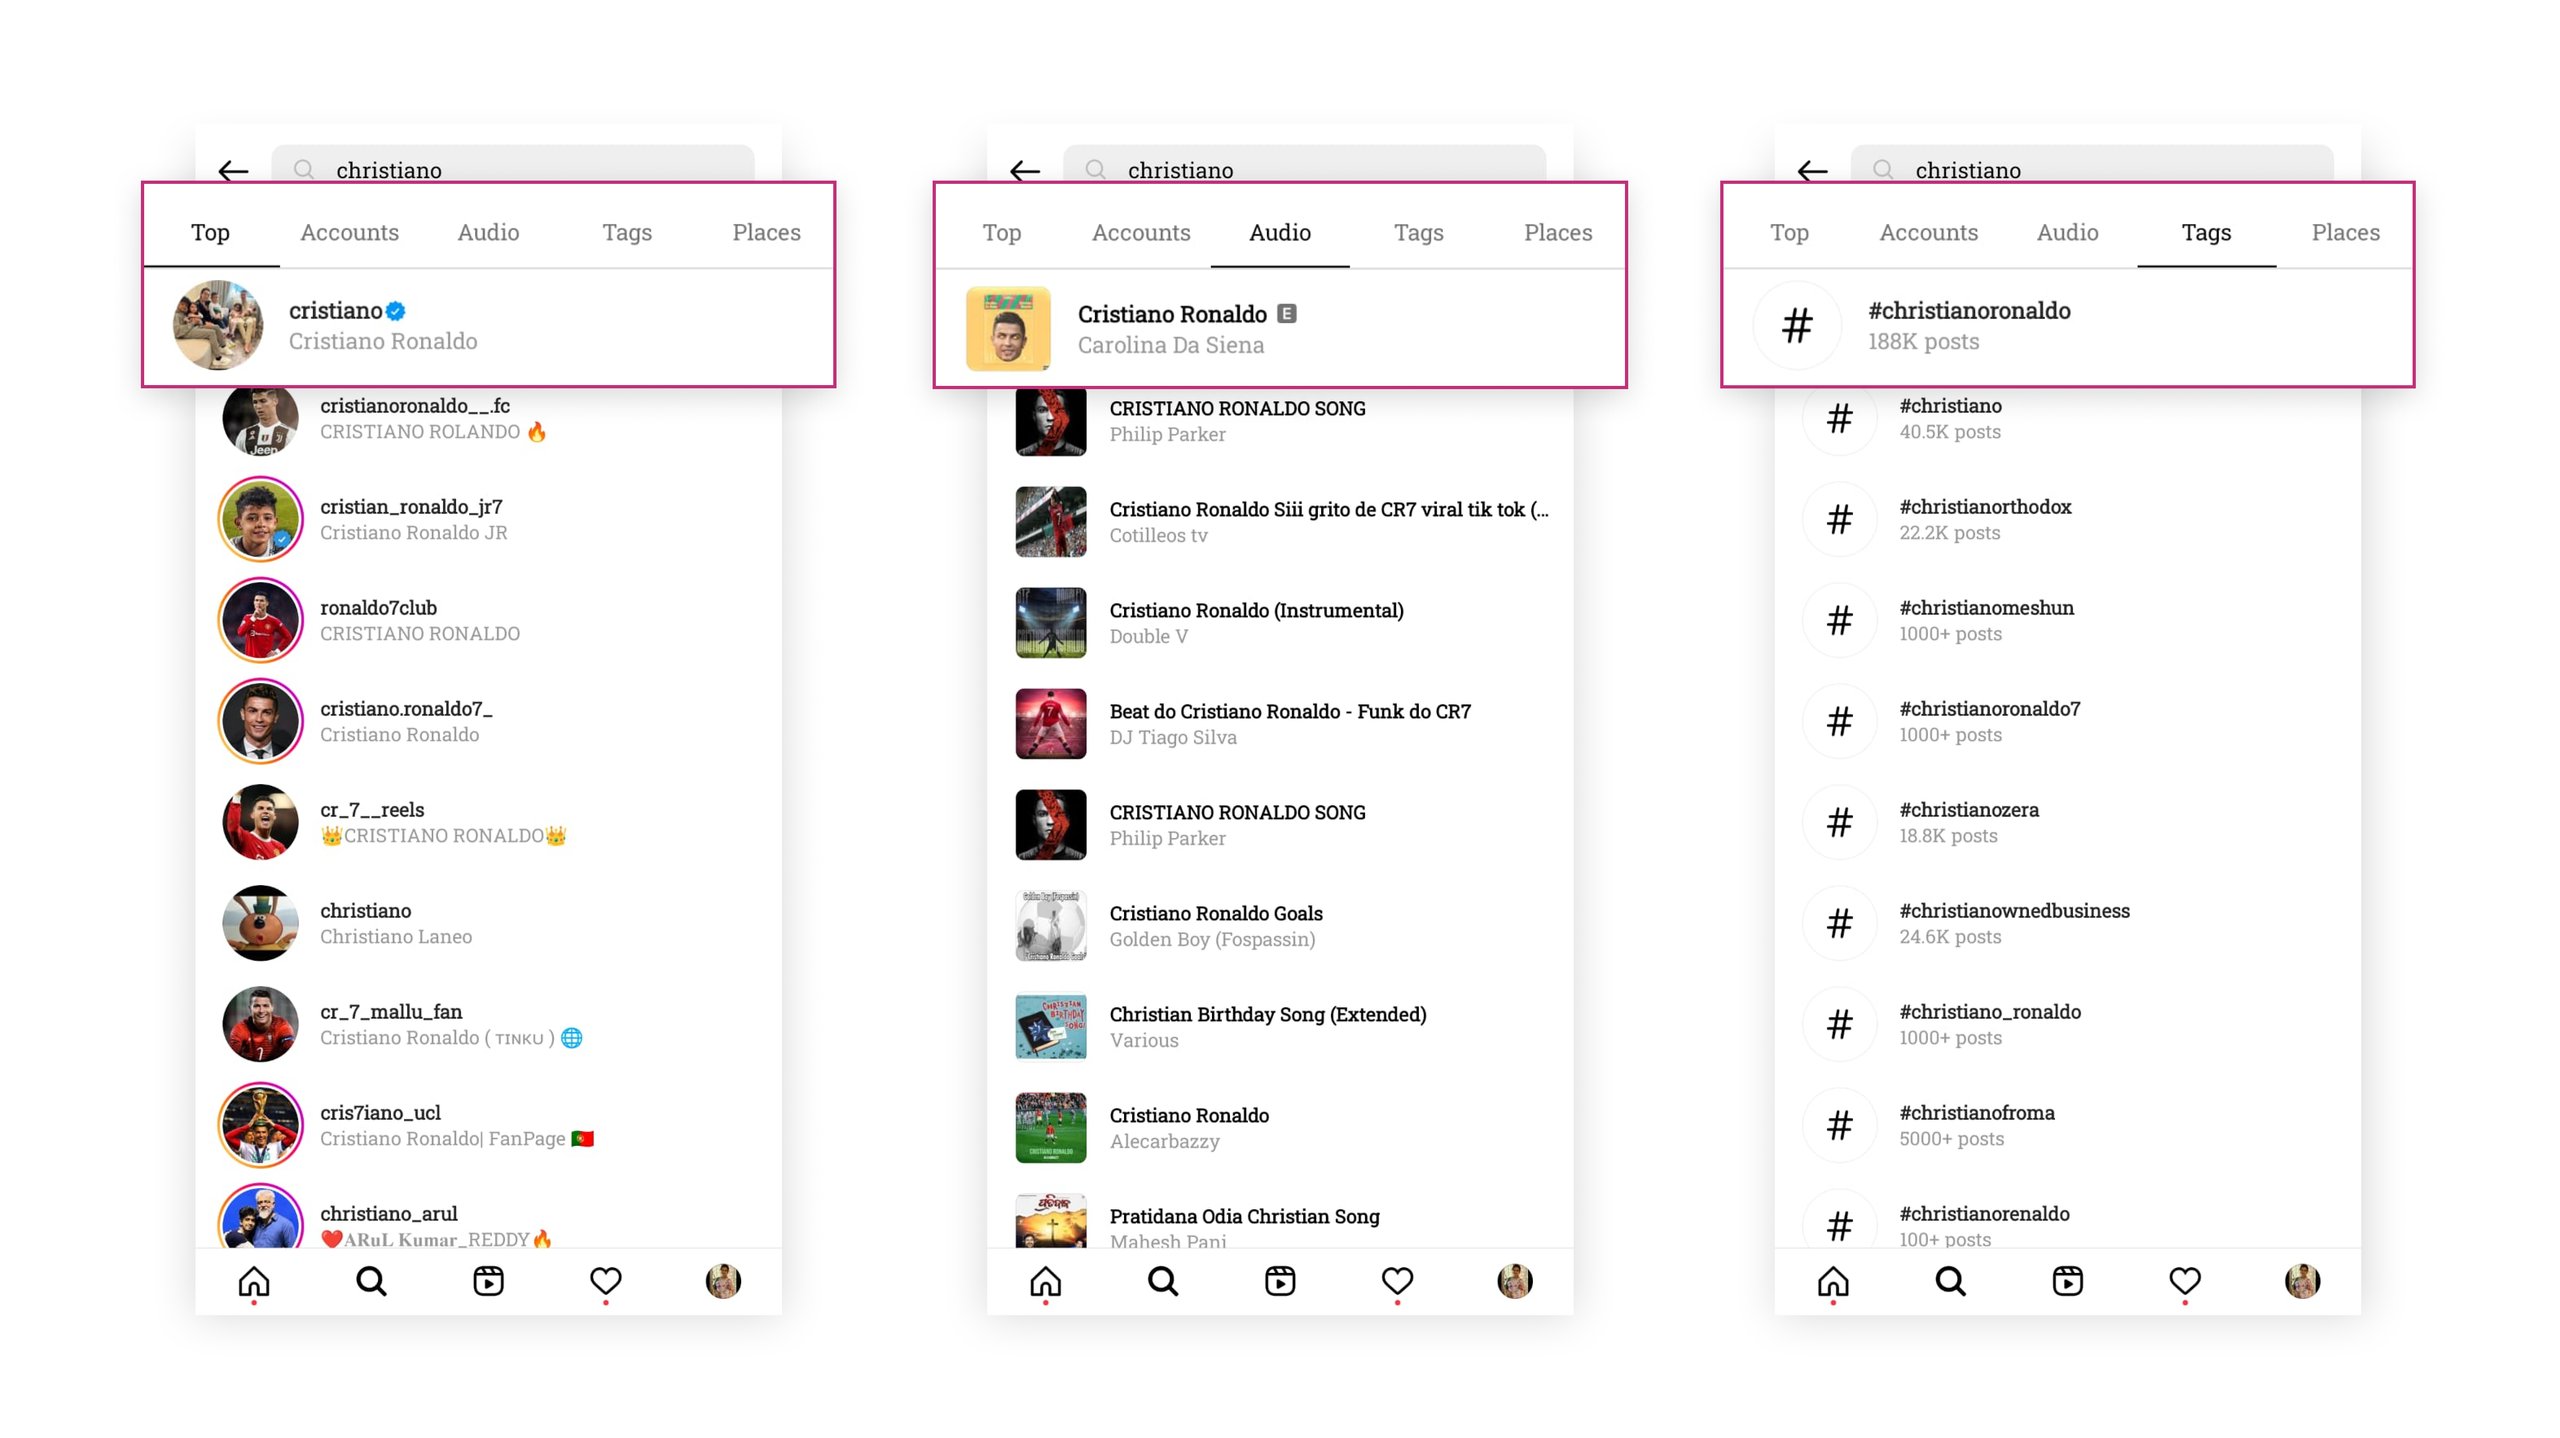
Example 1 – Search results by category
Some of the best implementations of app search are on social media sites like Instagram and YouTube. When you begin typing on the Instagram search bar, you will see results organized under categories like accounts, audio, tags, places, etc. Instagram and YouTube show search history, giving users one-click access to retry their previous search phrases.
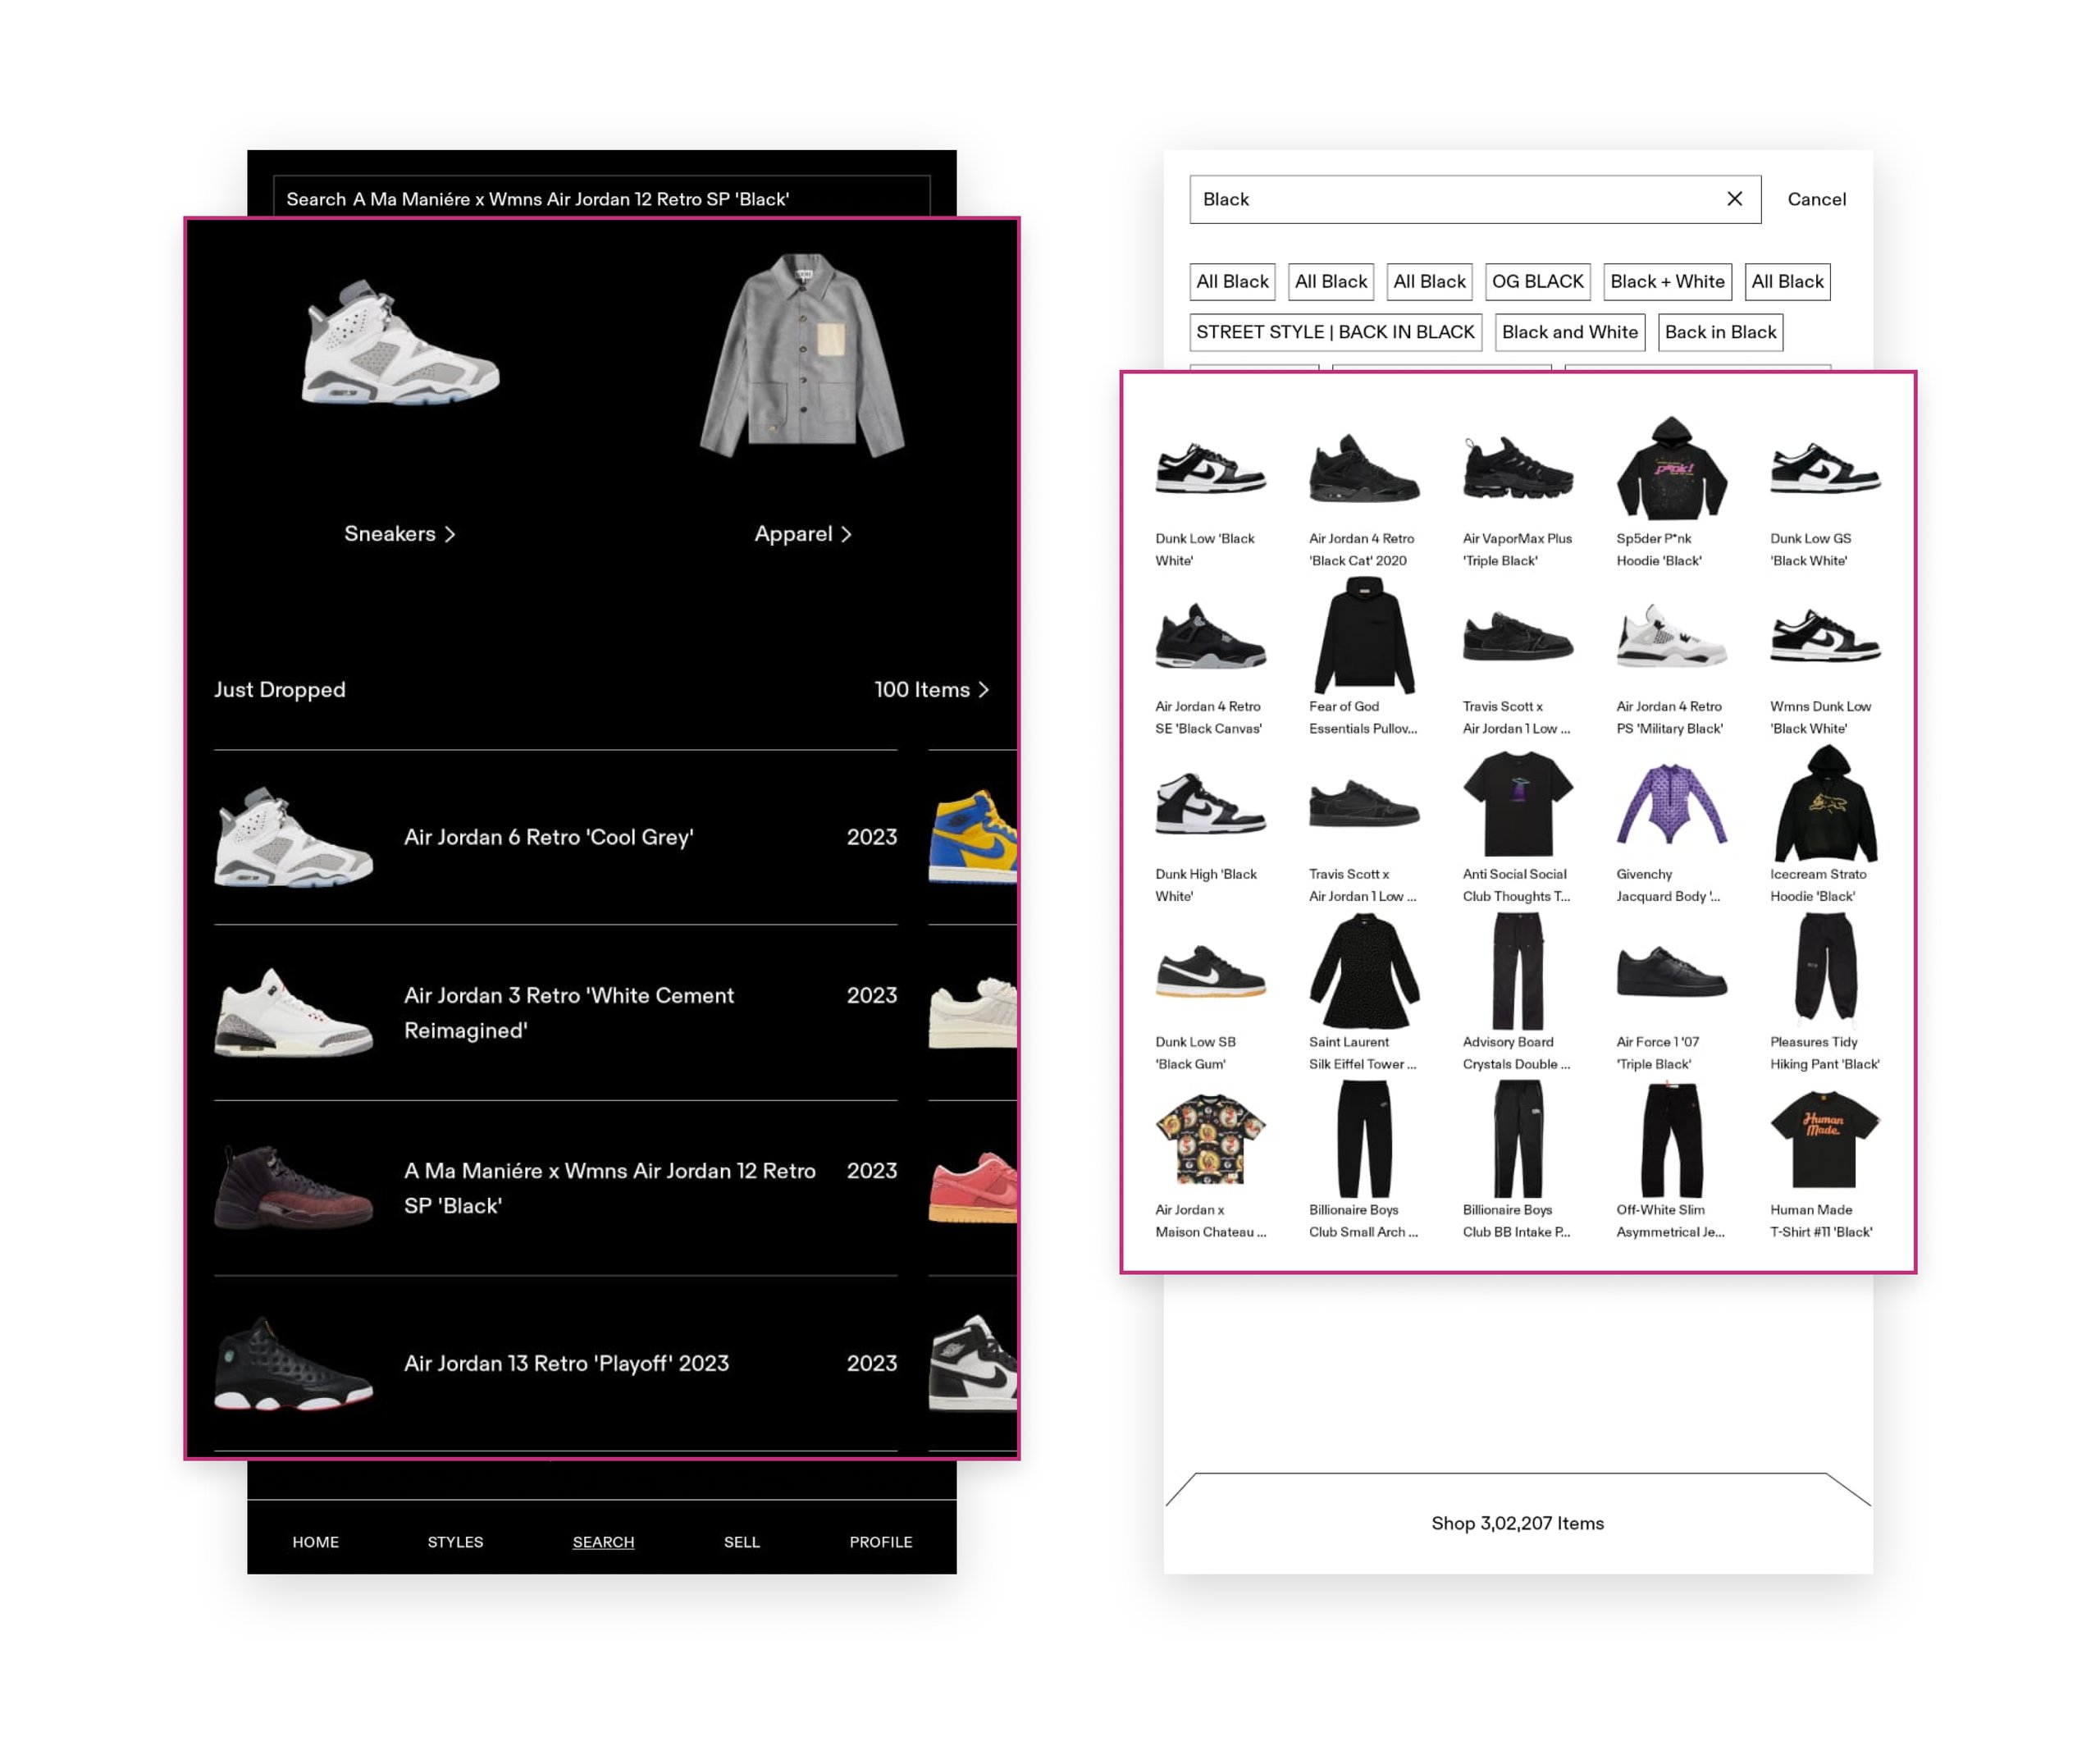
Example 2 – Search results with product suggestions
GOAT, an American eCommerce platform, has implemented an impressive search feature that enables users to find what they need swiftly. When you click the search icon on the bottom nav bar, it shows you a few product categories to browse and fills the page with items under the chosen category. When you click the search bar and start typing for something, you can see product suggestions with corresponding text and images.
Tests that can be devised
So, let’s say you want to improve the click-through rate for your search results. Here are two hypotheses you can test based on the above examples to meet the said goal.
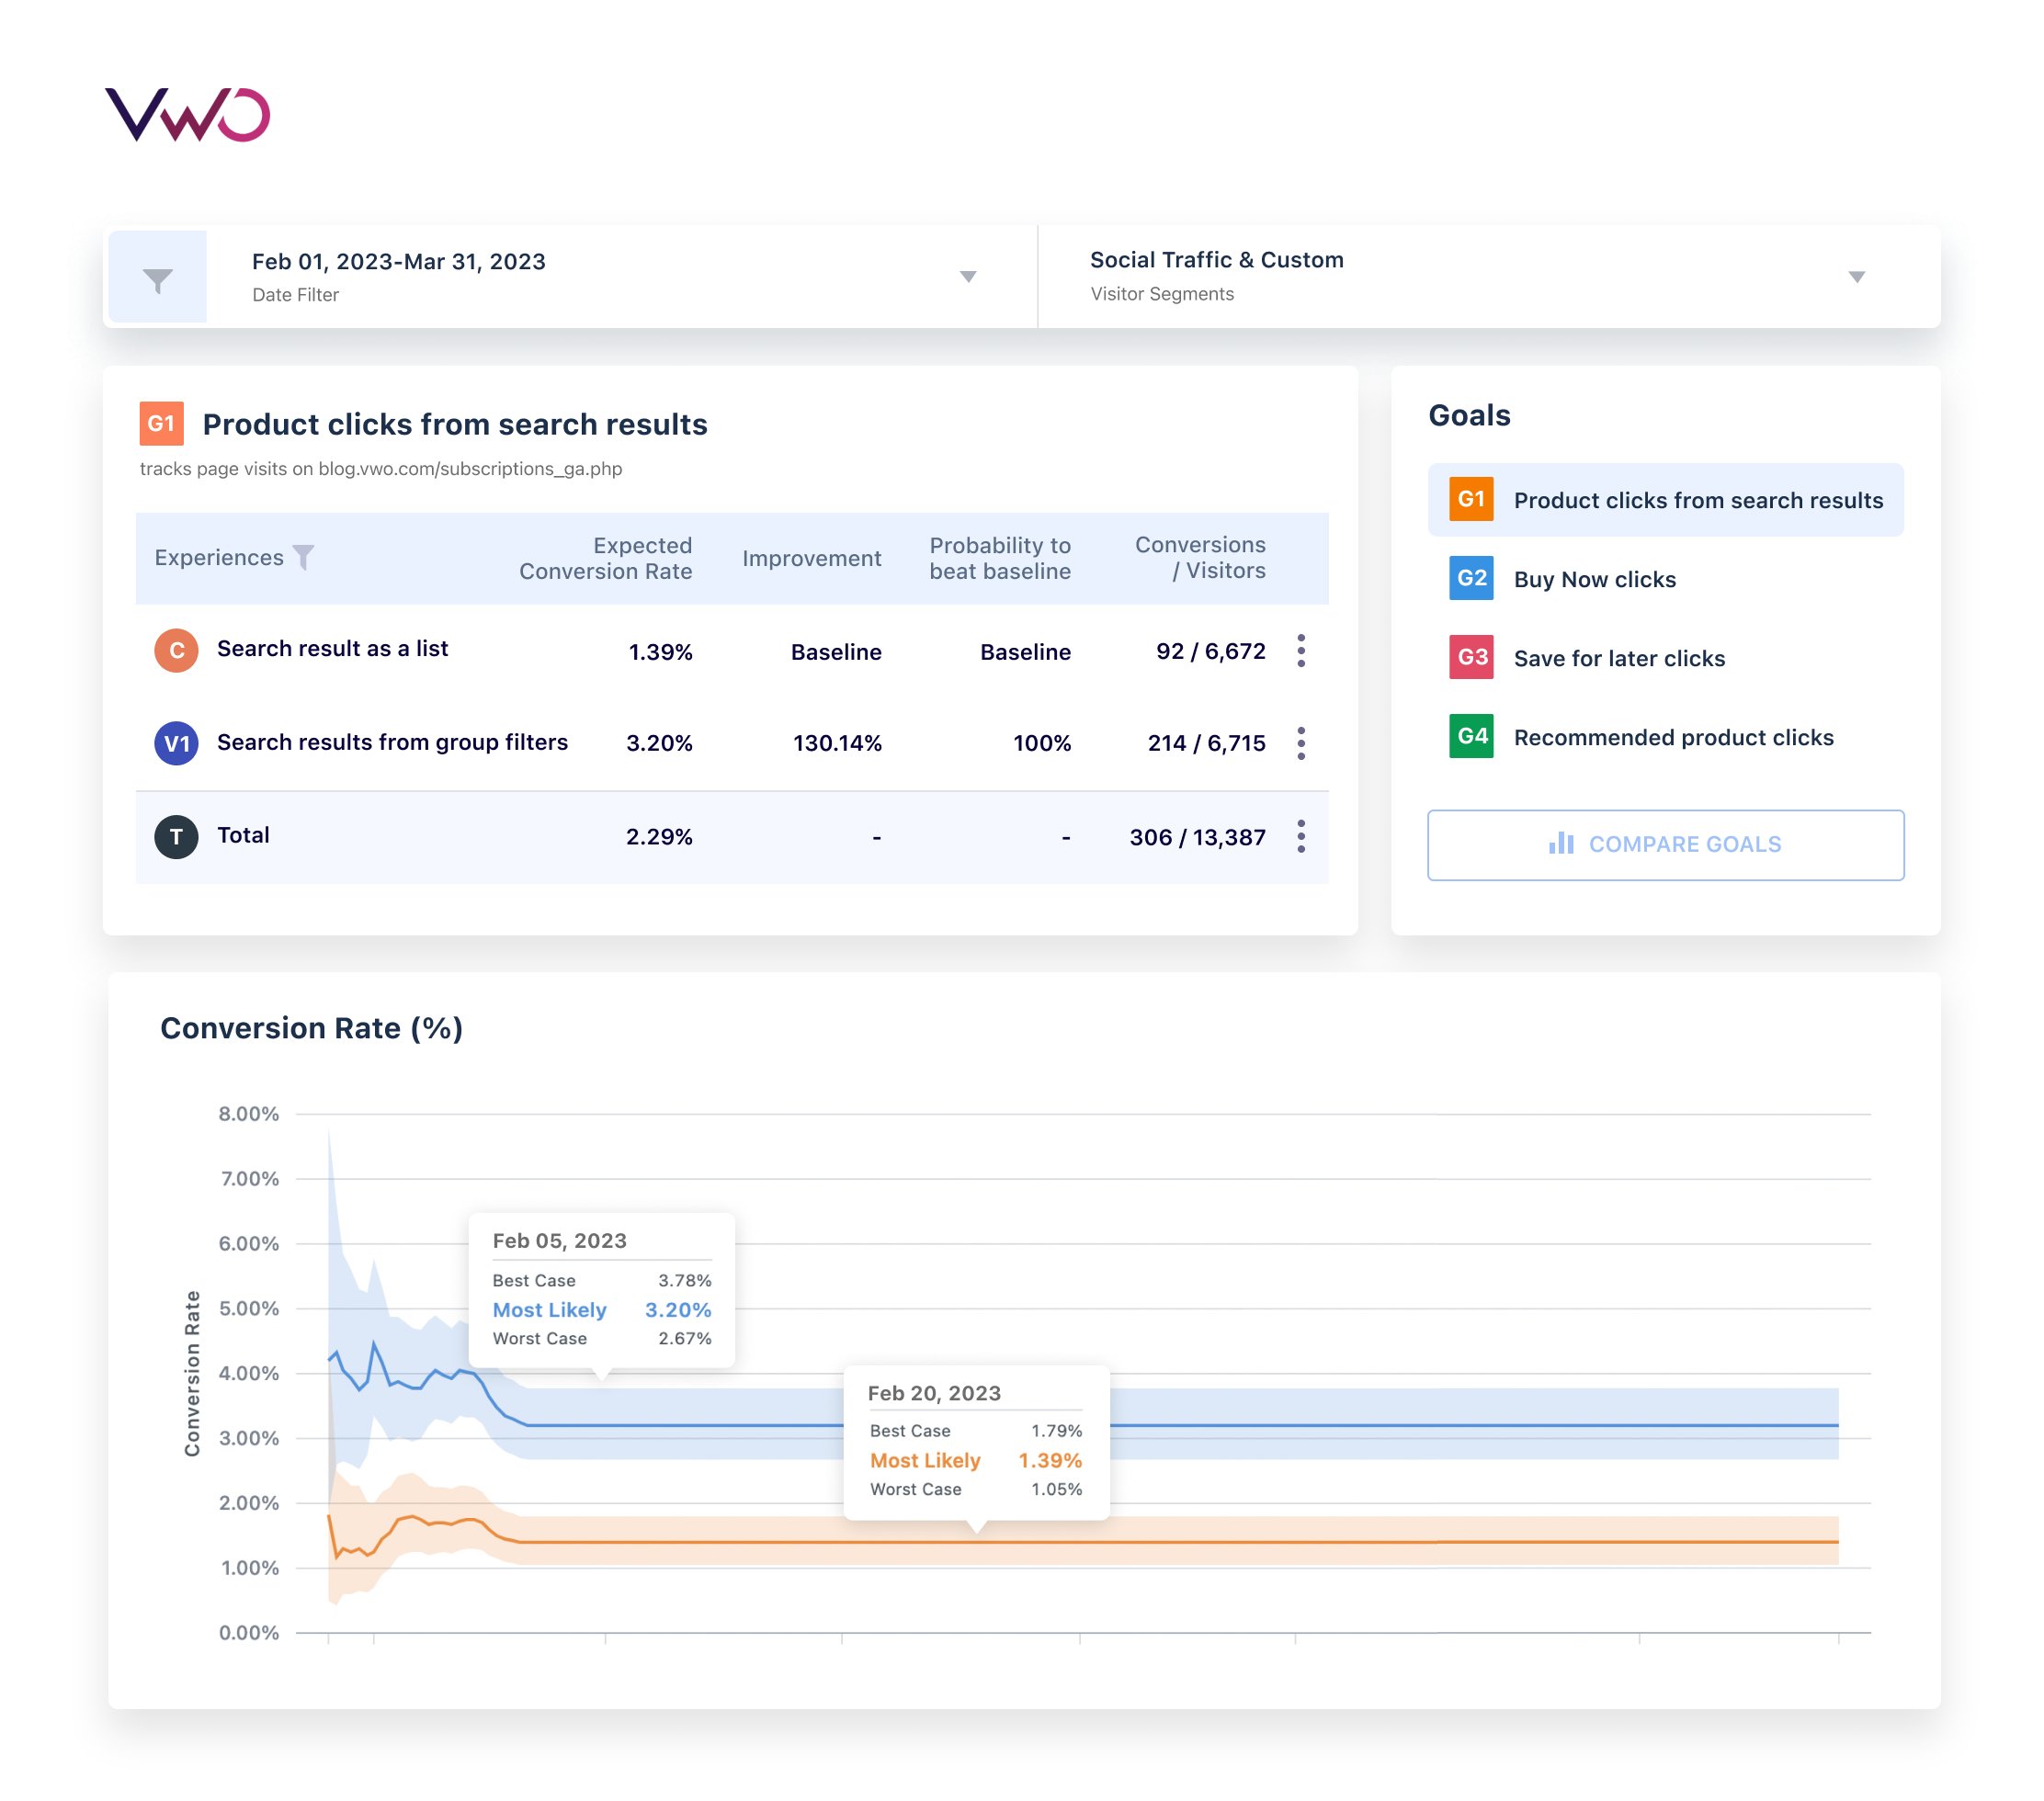
Test 1 Idea
Hypothesis 1: Grouping search results under different categories like people, places, and groups will improve user engagement.
Control: Search results are displayed as a product list.
Variant: Search results displayed along with ‘group by’ filters.
Test 2 Idea
Hypothesis 2: Showing images along with search results will improve the click-through rate for product suggestions.
Control: Results showing product suggestions that have only text.
Variant: Results showing product suggestions that have both text and images.
You can quickly implement such tests on VWO’s Mobile A/B testing platform in just a few steps. Below is a video demonstrating the steps involved in creating a test based on hypothesis 1 for an Android application built using Java, for instance. VWO also supports frameworks such as Flutter, Cordova, and React-Native.
Behind the scenes in VWO
VWO provides lightweight SDKs for iOS, Android, and all popular backend languages. Adding the mobile app SDK is a one-time integration process, after which VWO generates API keys that you can use for app initialization for both iOS and Android apps. You can refer to this comprehensive guide if you need a detailed explanation of the steps.
So you’ve created variations, added conversion goals, and launched a mobile app test. The next crucial step is to analyze and extract insights from the test results. VWO’s SmartStats engine, based on Bayesian statistics, does the heavy lifting to compute and present precise test results as easy-to-consume reports that you can analyze to draw actionable insights. VWO’s reports are comprehensive and allow you to filter down results by date and visitor segments and even compare the performance of multiple goals in a test.
2. Navigation experiments
Navigation is among the trickiest things to build because it involves multiple complexities like grouping, design, and ease of feature discovery. Experts recommend “Tree Test” to help set a baseline for how “findable” things are on your app. It is a closed test conducted among users to see how quickly they can find something within the app. This article is a great piece to get you started on Tree Tests and also serves as a significant first step toward designing experiments to improve navigation.
Metrics to track
Just like we did with experiments to improve search, here are a few metrics you must keep a tab on
- Item findability rate
- The time taken to find a feature or product
- No. of times users got it right on their first click
- Variability in finding time
By combining the performance of these metrics with qualitative research insights, you can determine an effective strategy for enhancing your app’s navigation.
Examples that you can try
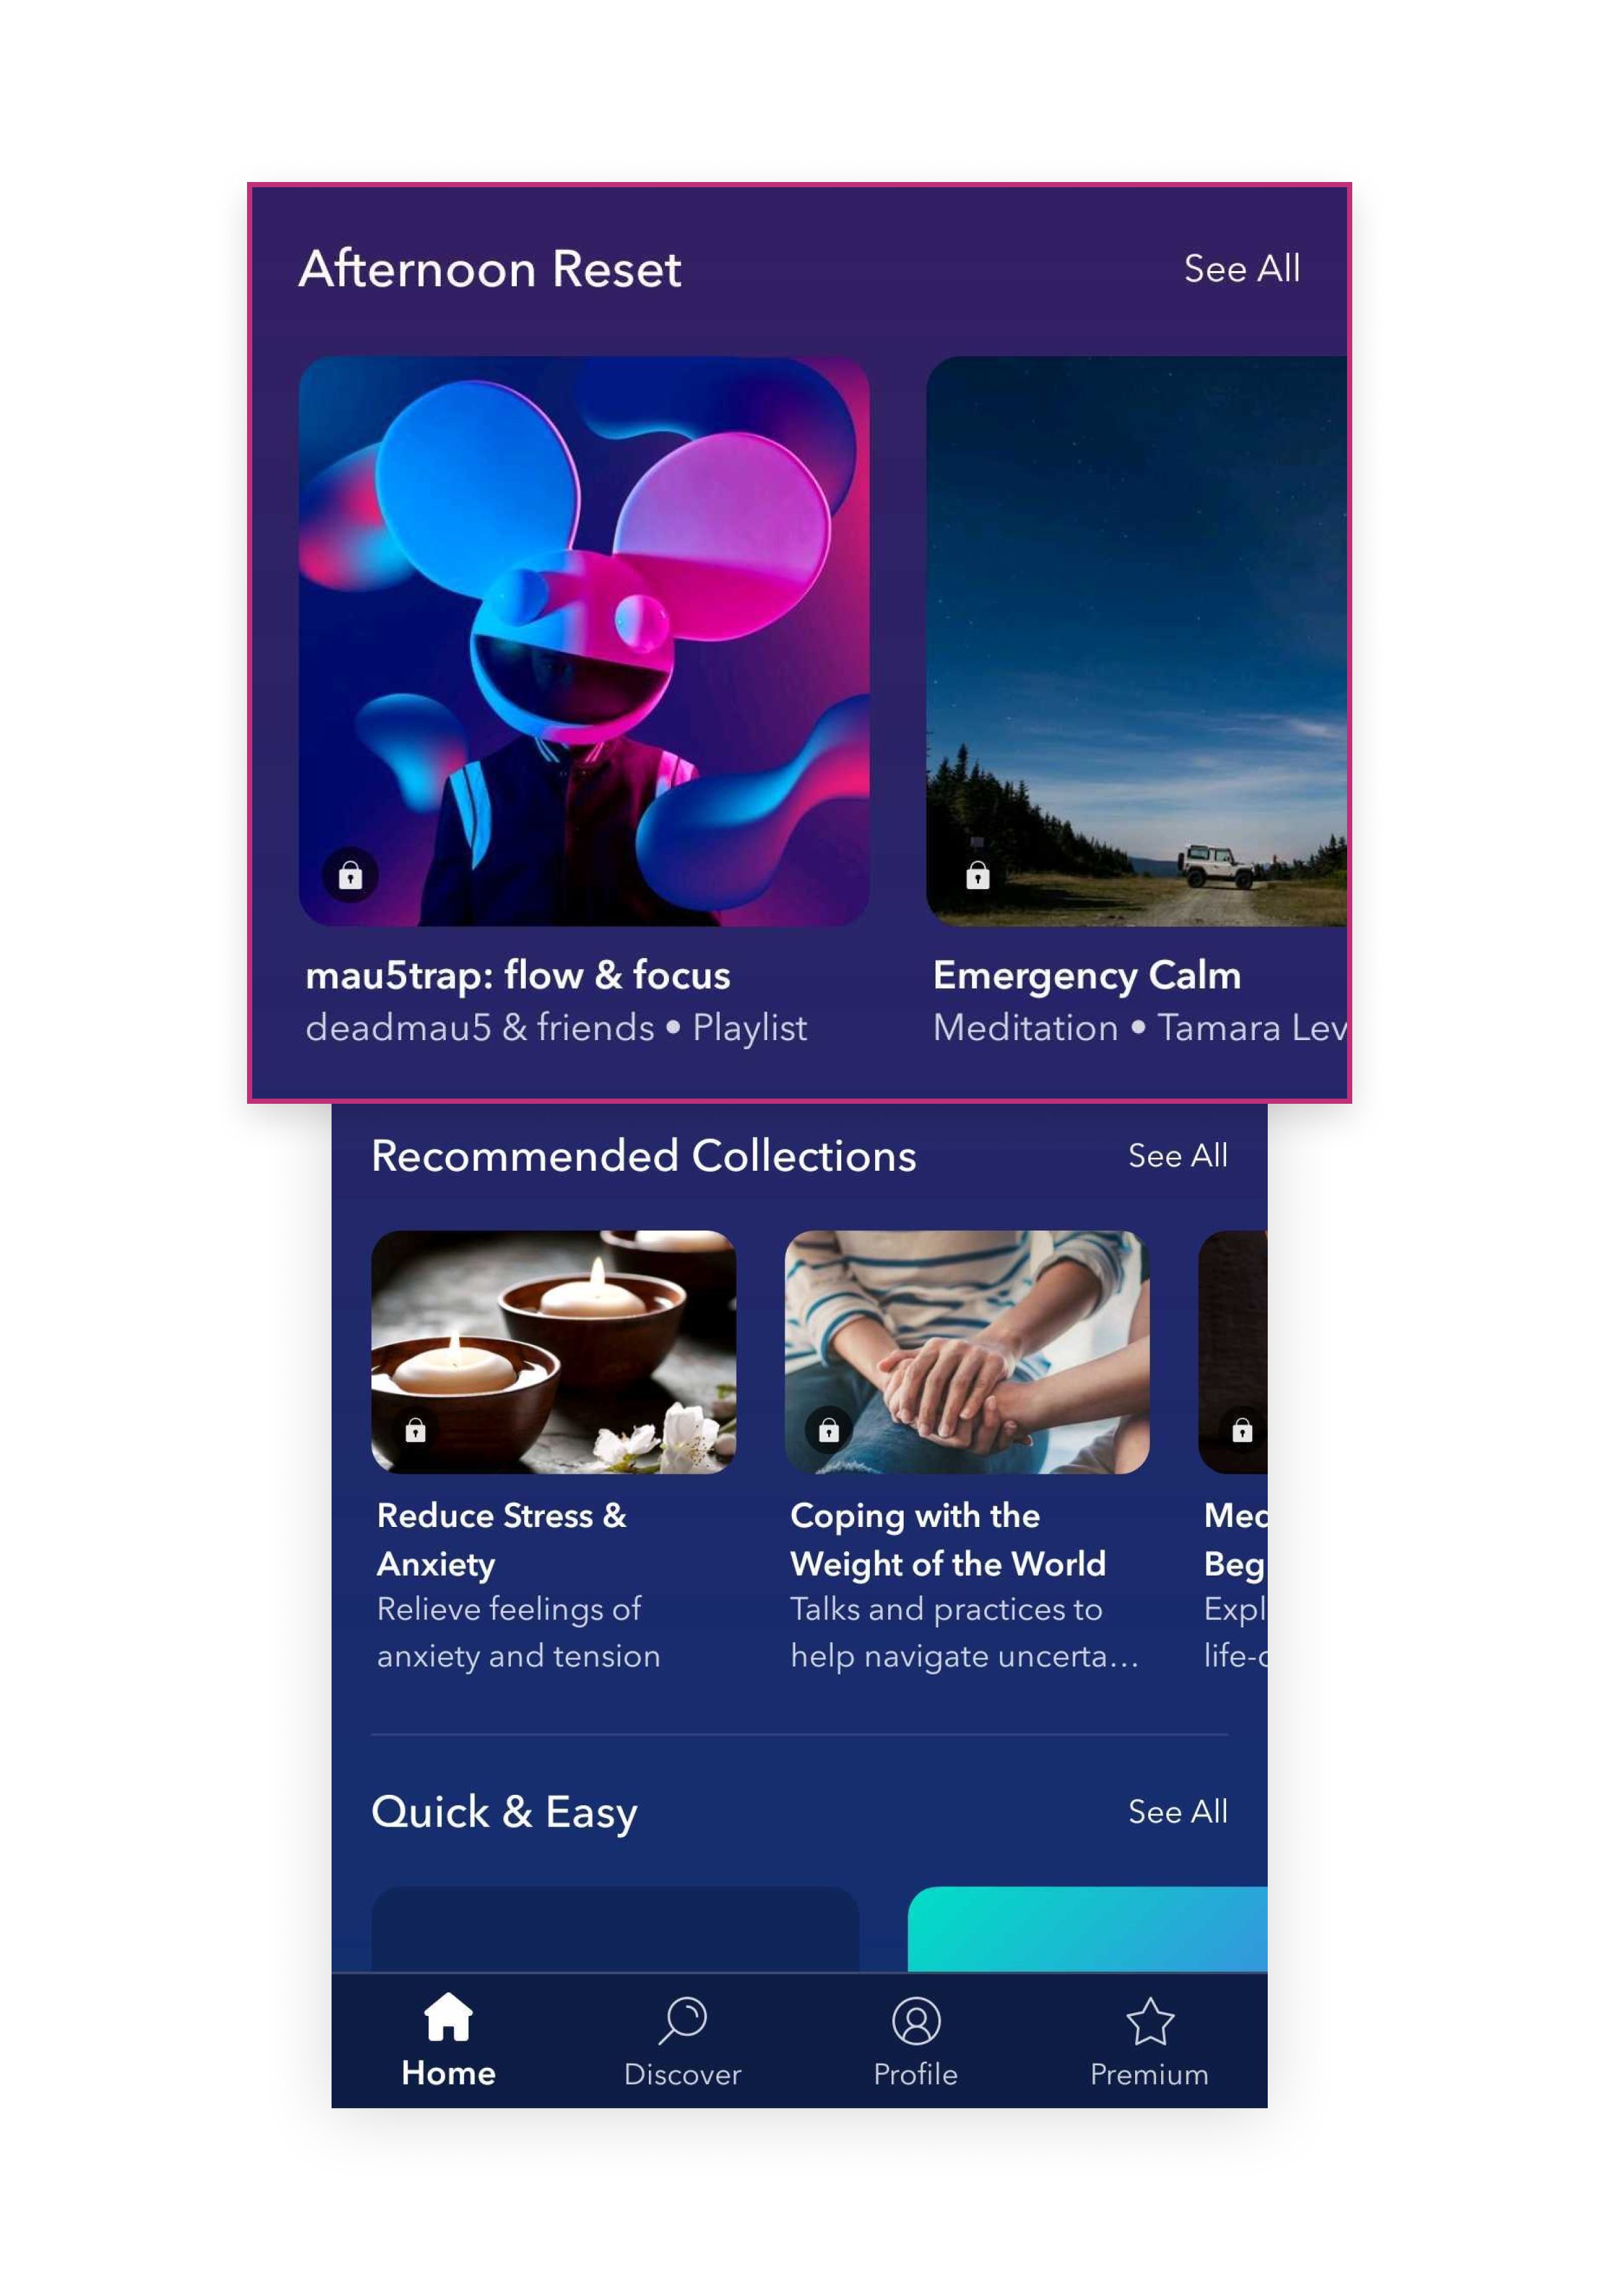
Example 1 – Card navigation
If you’re looking for navigation inspirations, one of my favorites is Calm, a meditation app. Their layout resembles a series of doors, each serving as an entry point. The cards are further segmented into categories like ‘Mental Fitness,’ ‘Recommended Collections,’ ‘Quick & Easy,’ and so on. The hamburger menu could be an alternative to this navigation style, but its use has declined due to its low discoverability, decreasing user clicks. On the contrary, card-style navigation is increasingly gaining traction for its user-friendly design.
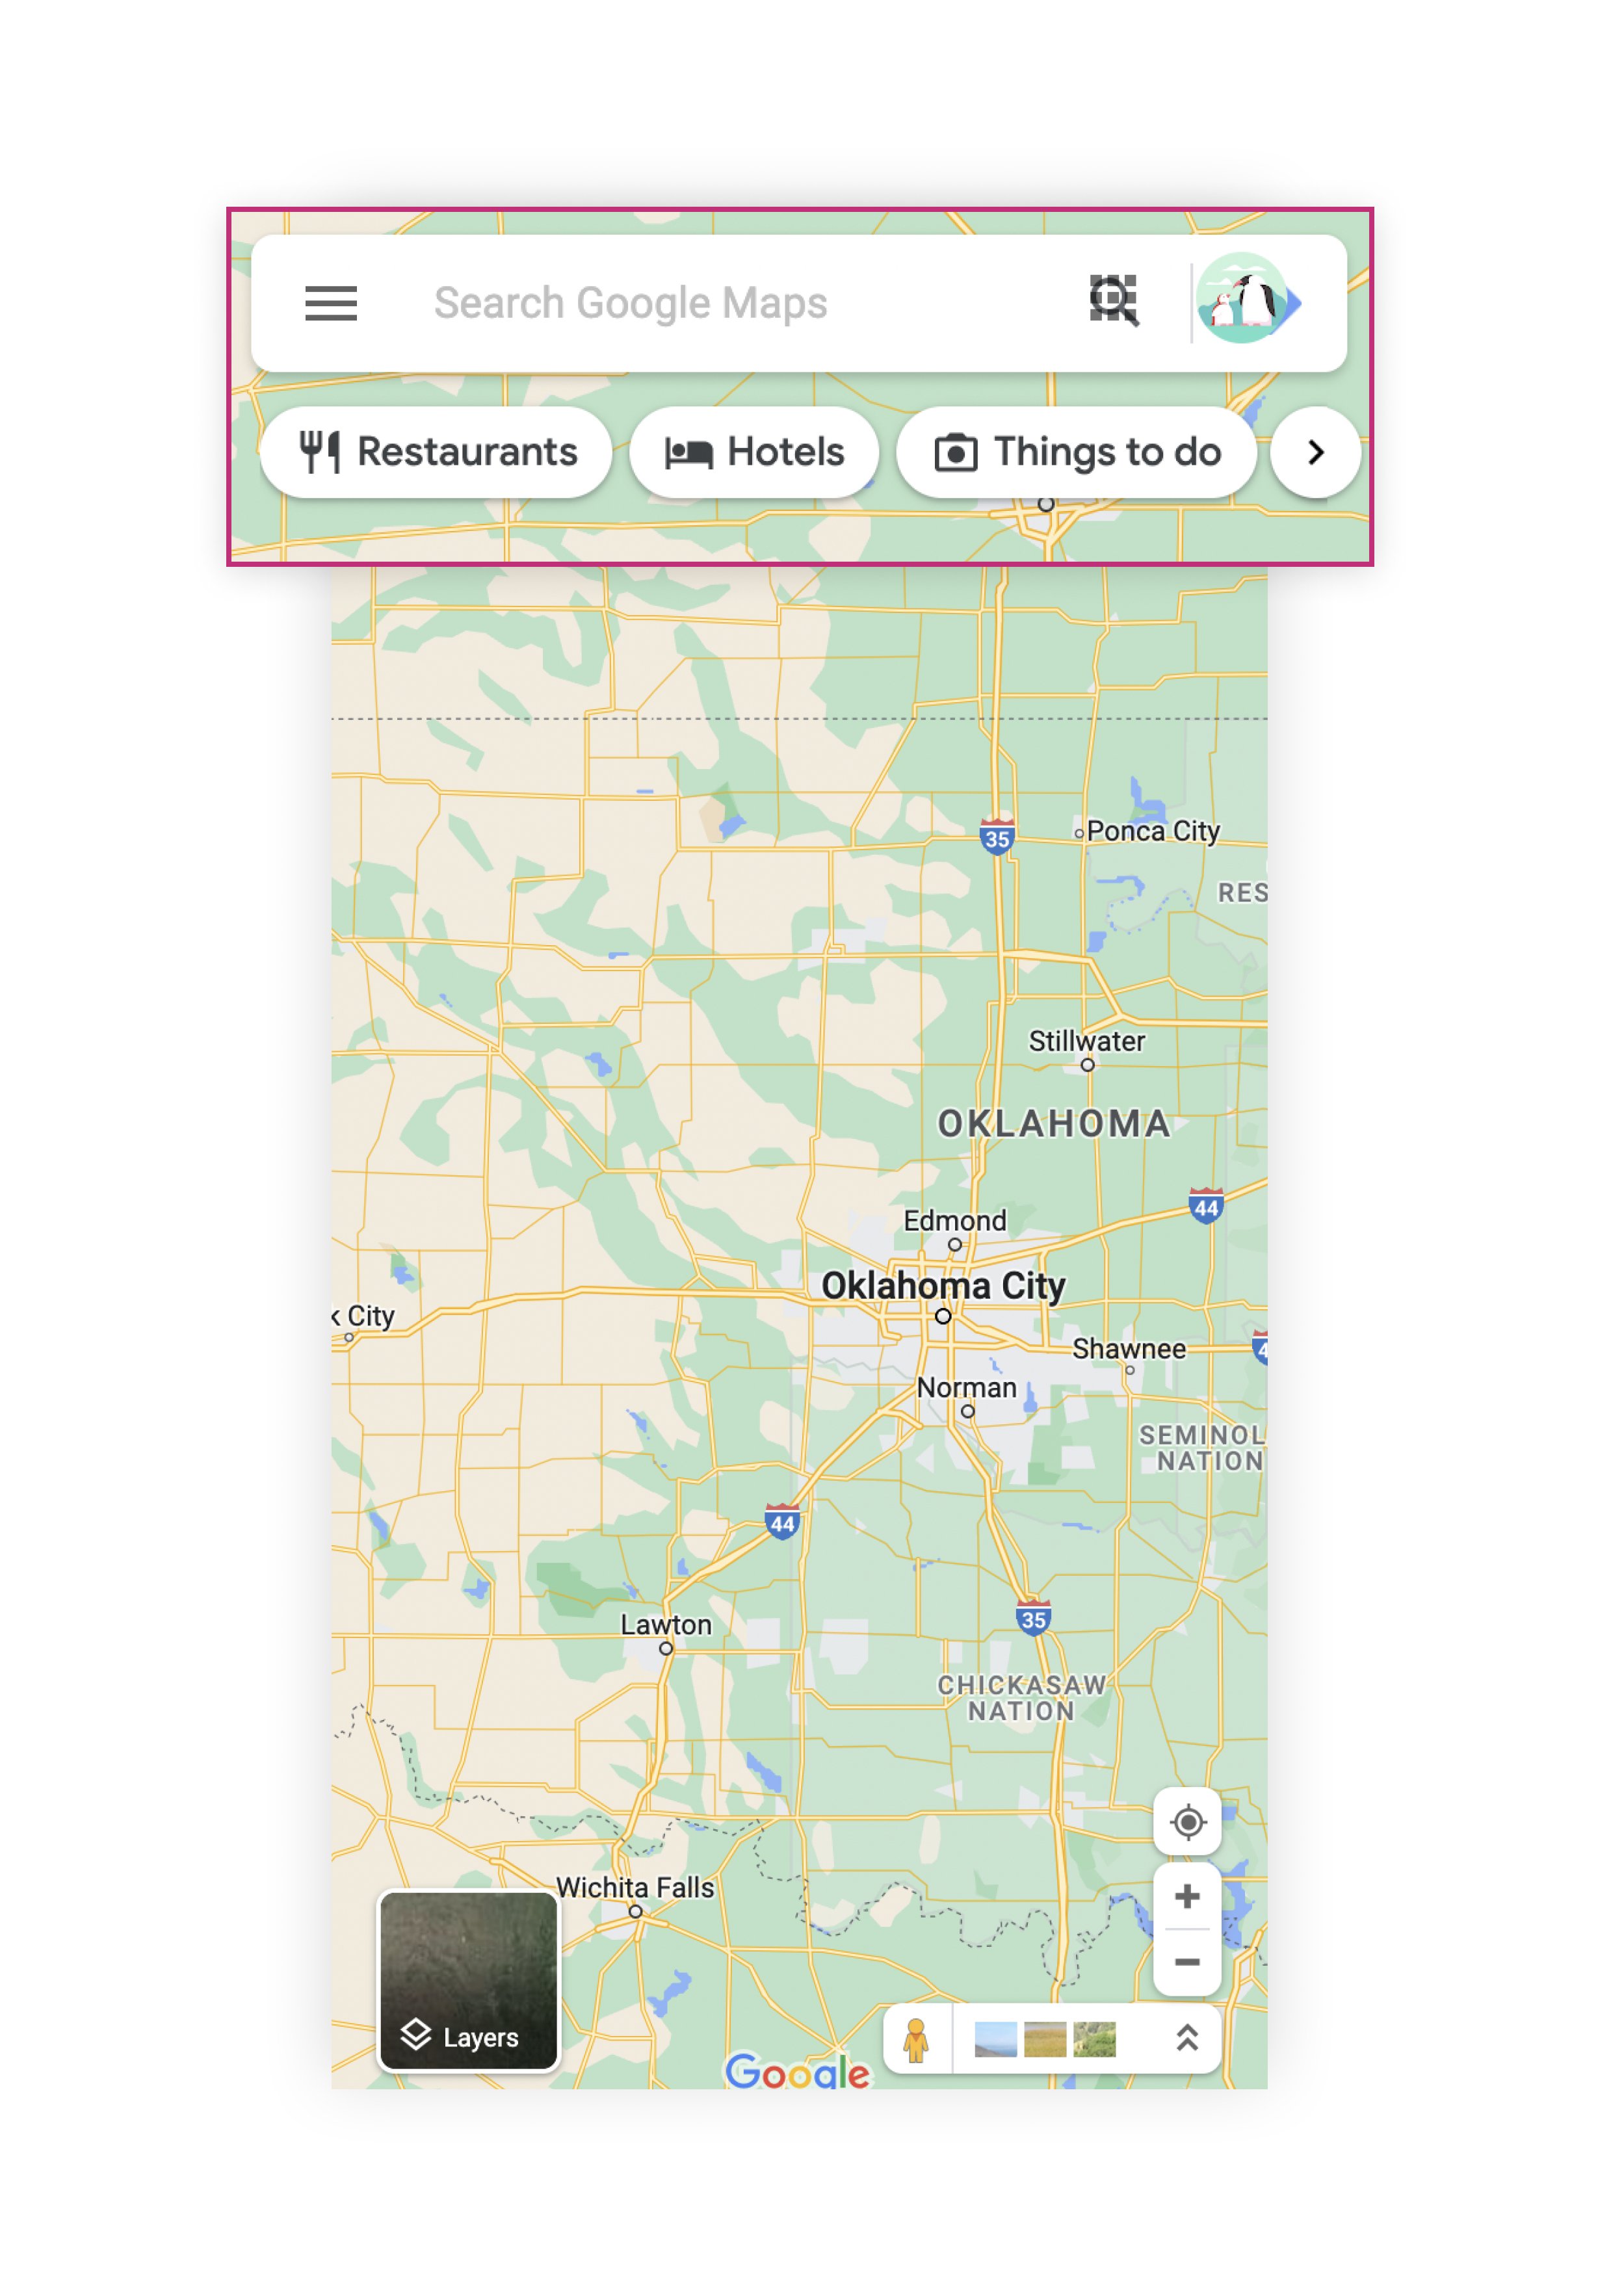
Example 2 – Simple tag navigation
Google Maps is another app that has user-friendly navigation. Once you enter a location, you see options like directions, share, and save location in the form of easily noticeable filter buttons. In addition, you also find commonly used facilities as filter buttons, helping you explore restaurants, shopping malls, ATMs, and parks near the entered location. Google Maps navigation is simple and helps people get the most out of the app.
Tests that can be devised
Improving the click-through rate of products from the navigation is usually the main goal of eCommerce owners trying to improve their app navigation experience. If that’s what you’re trying to do as well, here are two hypotheses to test:
Test 1 Idea
Hypothesis 1: Replacing the hamburger menu with card-based navigation tiles will increase conversion rates.
Control: The hamburger menu displays different product categories for users to explore.
Variant: Product categories shown in a card layout format.
Test 2 Idea
Hypothesis 2: Showing filter buttons for everyday use cases will result in users finding the relevant information quicker and using them more often.
Control: The feature search bar stays at the app’s top without filter buttons.
Variant: The search bar is at the top, with filter buttons for everyday use cases are at the top and bottom of the screen.
If you wish to run both tests in parallel, you can do so with VWO without worrying about skewed data. VWO has the capability of running mutually exclusive tests on mobile apps. This ensures that a mobile app user participating in one campaign does not participate in another campaign that is part of the mutually exclusive group. You can accomplish this by adding multiple campaigns to a mutually exclusive group to ensure no visitor overlap across any of the campaigns. Creating a mutually exclusive group on VWO guarantees that your mobile app provides a consistent experience and that one campaign’s results are not influenced by another, attributing conversions to the right campaign.
3. Onboarding experiments
The app onboarding experience is subject to most change as it evolves with your products, categories, audience, goals, and others. While an onboarding experience changes vastly depending on what your product does, all good ones have a few things in common. They:
- Reinstate the value proposition of the app
- Familiarize users with the features and benefits
- Encourage successful adoption of the app
- Minimize the time taken by customers to derive the value they want from using your app
So, if you want to improve your app optimization experience, it might be a good idea to find answers to some pertinent questions first:
- Is our app onboarding process too lengthy?
- When do people realize value during the onboarding process?
- Which steps in the onboarding process should be optional?
- Do users look for onboarding help and support?
Metrics to track
To support your goals and discussions effectively, relying on data and allowing them to steer your testing roadmap is essential. Tracking basic metrics like the ones listed below can be helpful:
- Onboarding completion rate
- Time to value (time between onboarding and getting the first value from your app)
- Activation rate reflects how new users perceive your app
- No. of onboarding support tickets generated for a specific period
Examples that you can try
Let us discuss some examples that can inspire you to test and improve your app onboarding process.
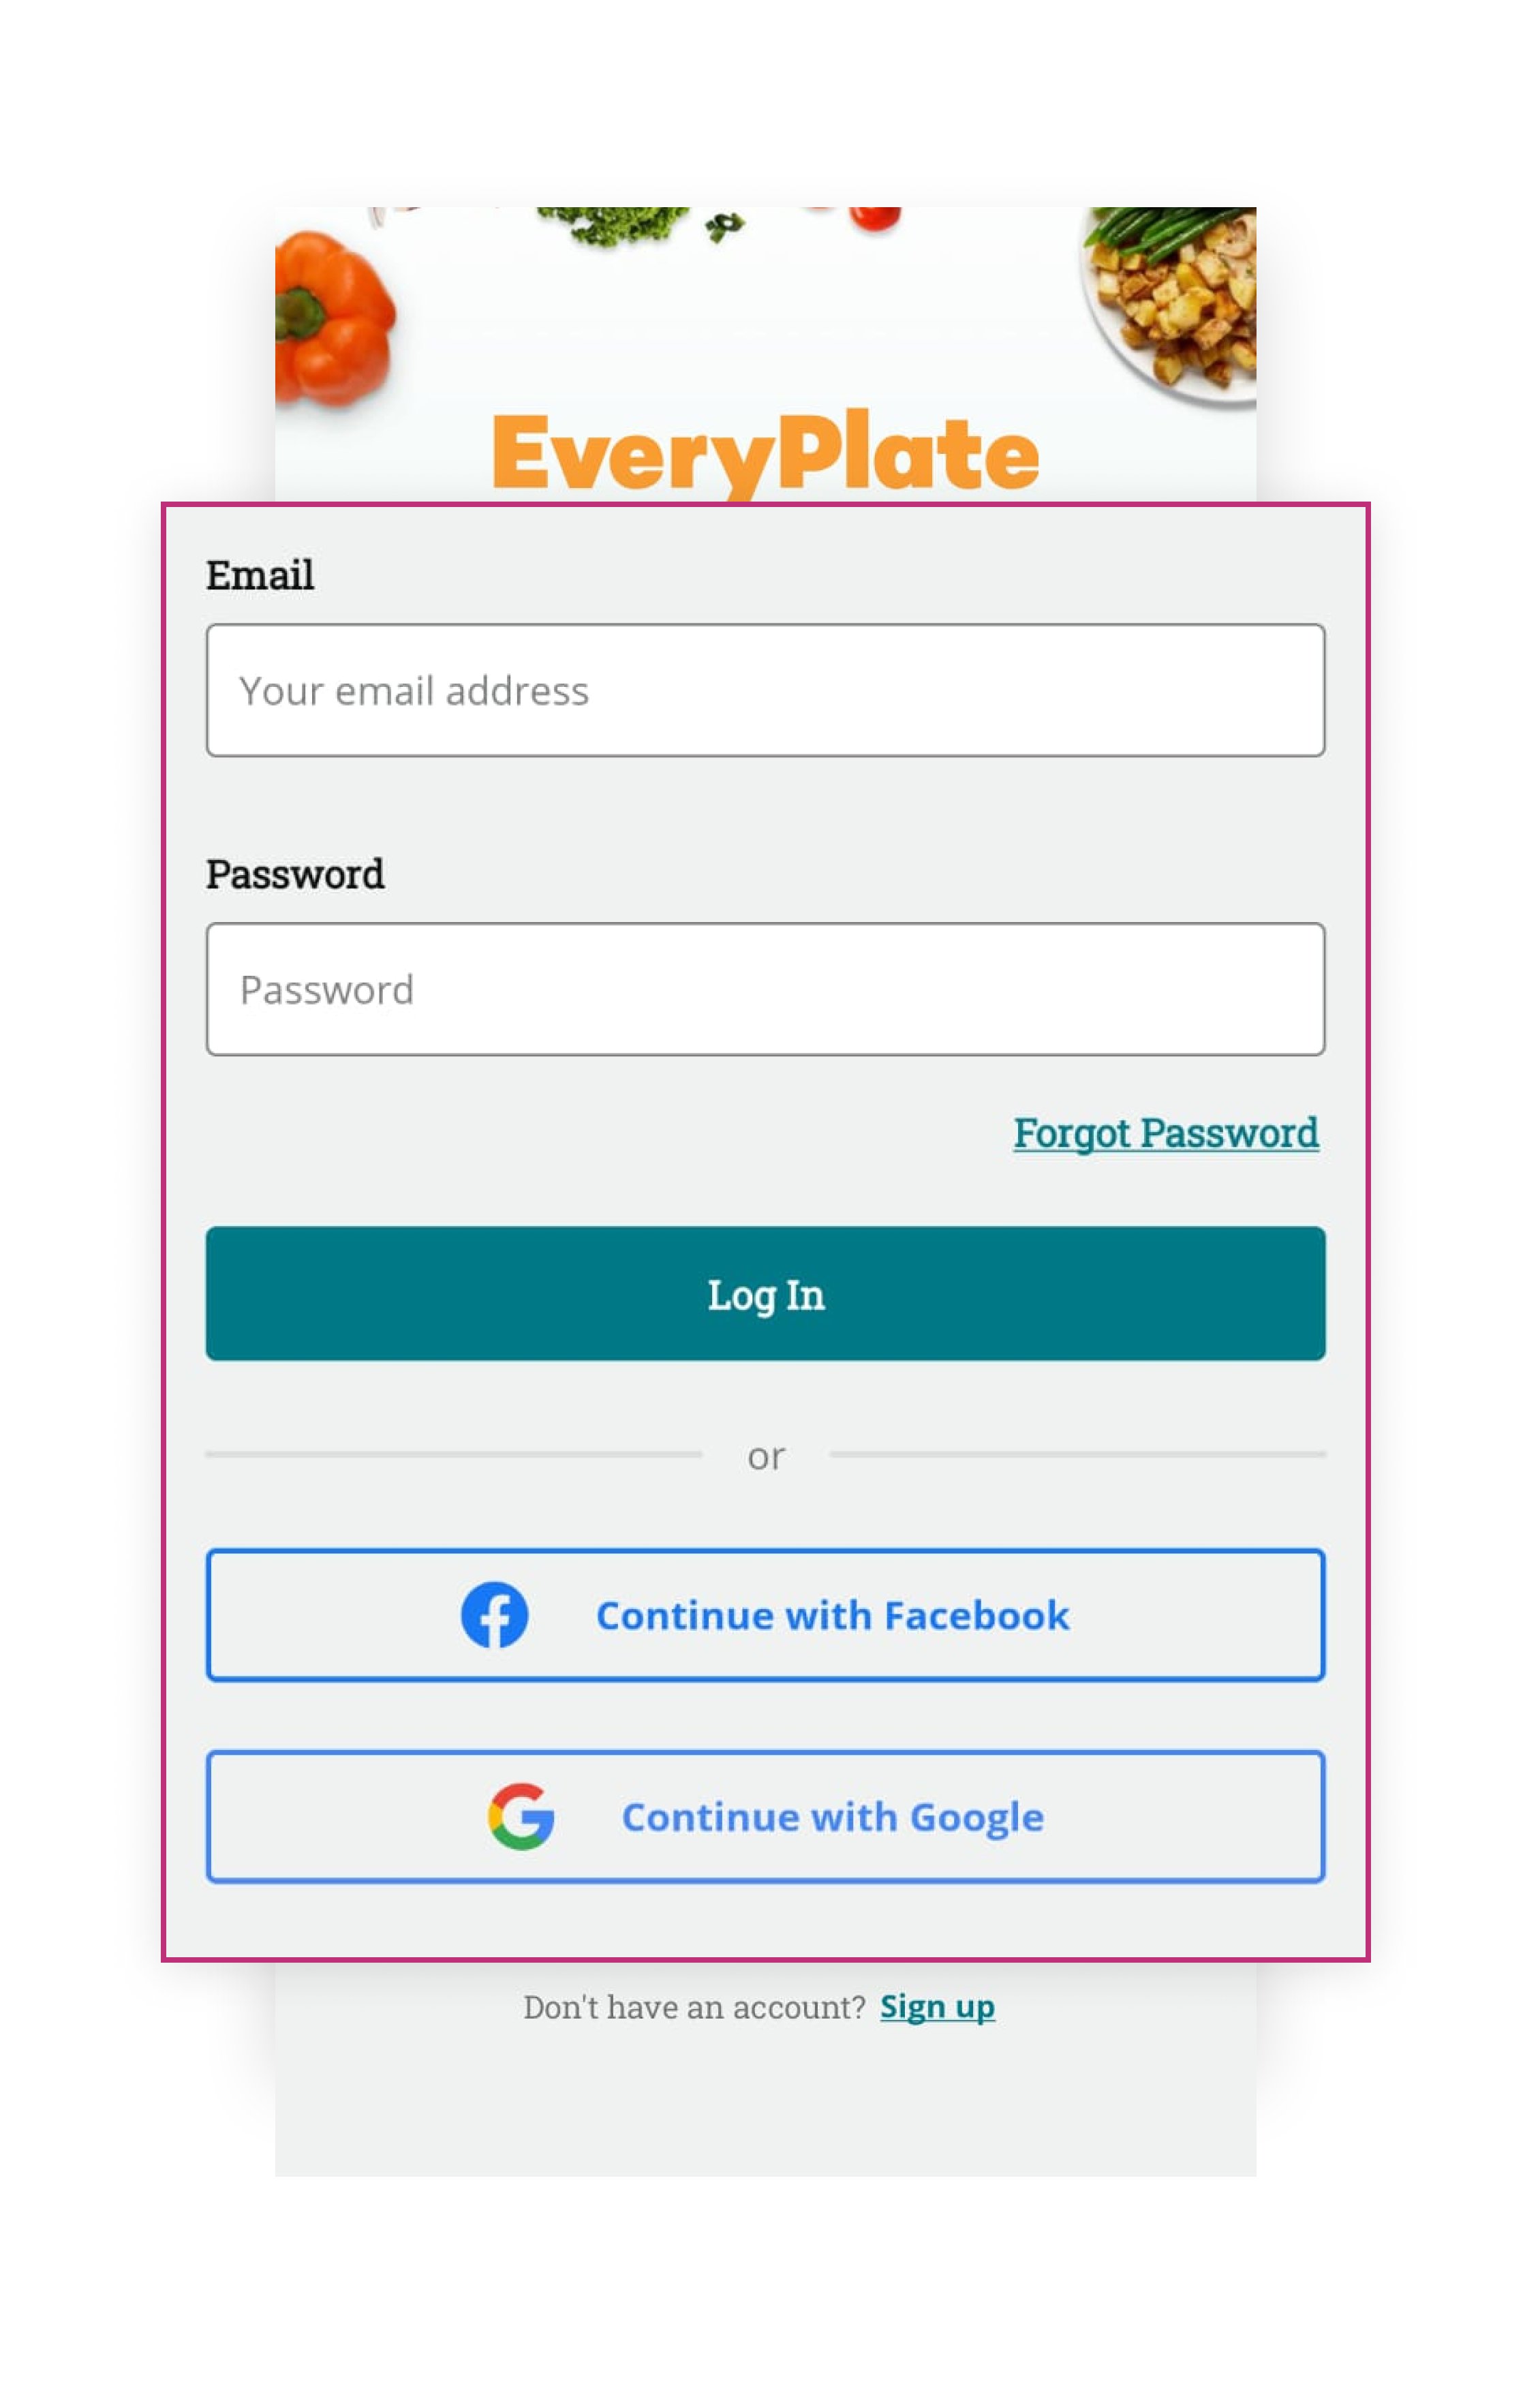
Example 1 – Multiple log-in options in the onboarding flow
Do you wonder if you should offer email, social login, or both during user onboarding? Every Plate, a US-based meal delivery platform, lets users choose any of the two options for logging in.
Example 2 – Multi-step onboarding flow
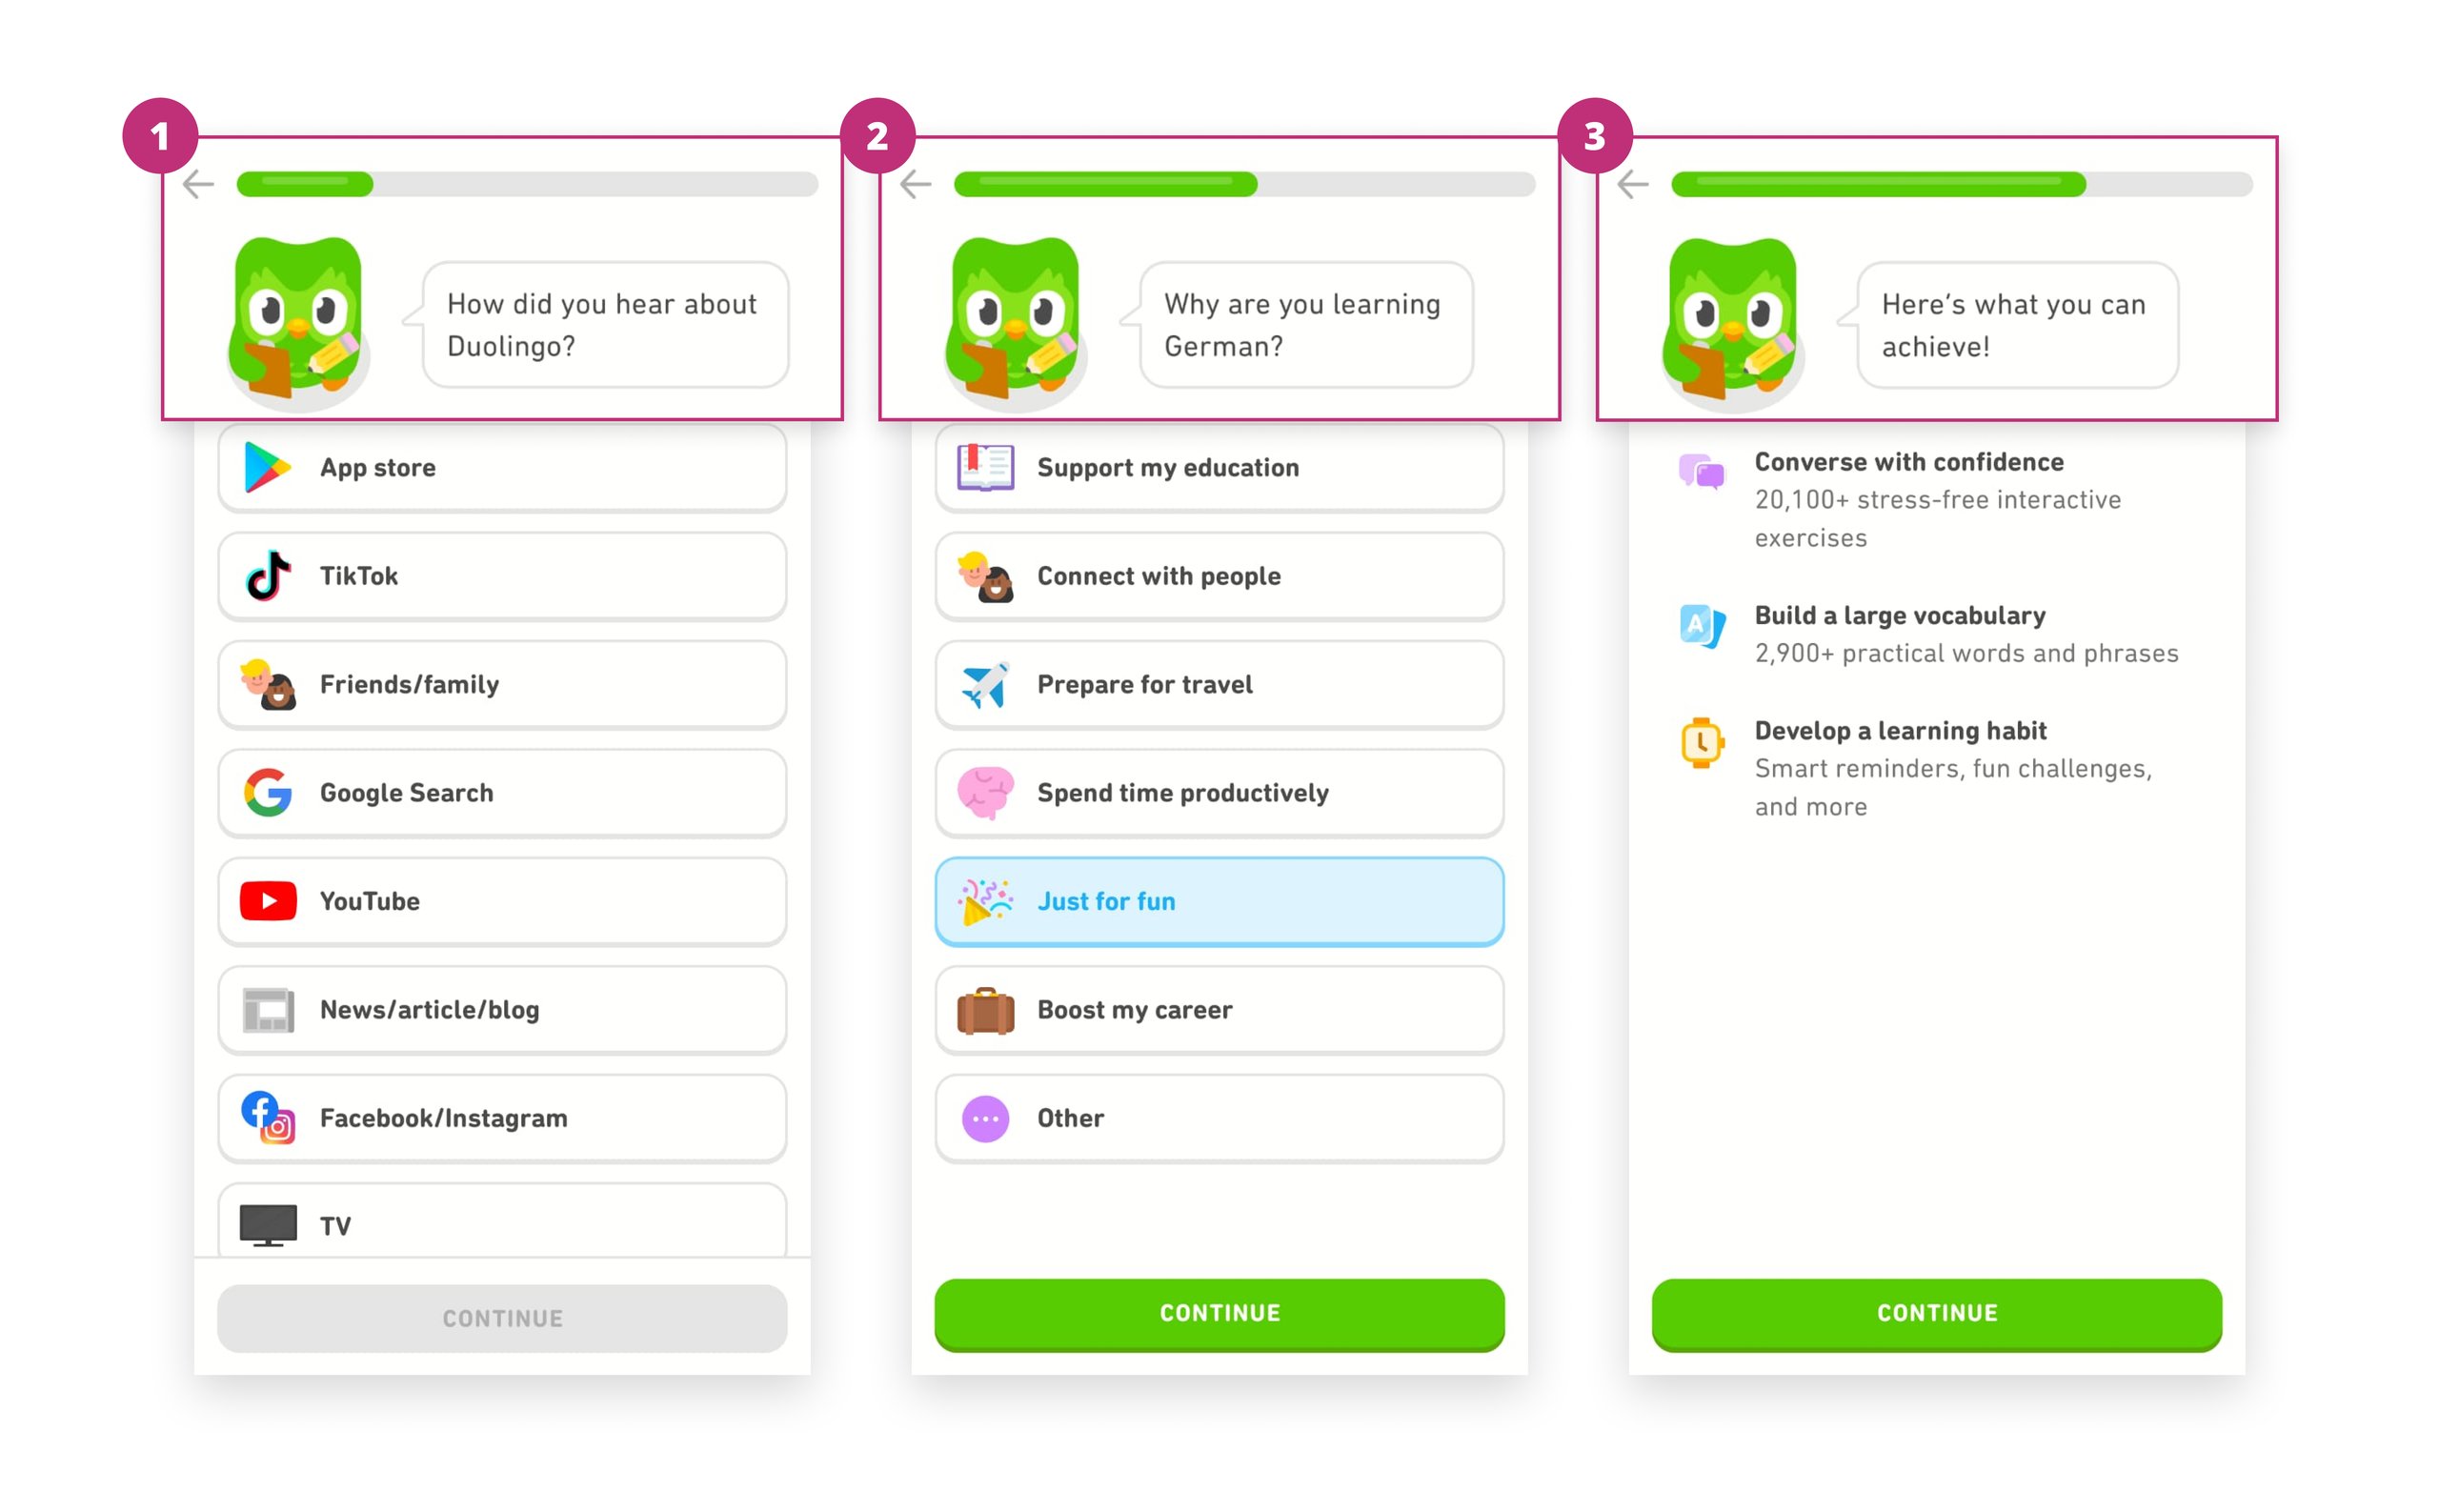
How many steps should you include in your app onboarding process? See how Duolingo has aced it – proving that a well-crafted multi-step onboarding process can be successful without losing the user’s interest. The language learning app displays a series of screens asking users several (yet relevant) questions during onboarding to improve their learning experience.
Tests that can be devised
Would you like to know how many people have completed the onboarding process or how many support tickets have been raised? You can keep track of these goals by trying out the following testing ideas.
Test 1 Idea
Hypothesis 1: Providing social logins along with email can result in better conversion in step 1
Control: Just email/phone login
Variant: Email login + Google + Facebook
Test 2 Idea
Hypothesis 2: Showing a progress bar during onboarding will nudge users to complete the onboarding process.
Control: A multi-step onboarding process presented without a progress bar.
Variant: A multi-step onboarding process with a progress bar at the top of every onboarding screen.
With a tool like VWO, you can customize the target audience for your tests based on various parameters such as technology, visitor type, time, etc. You can select a targeting segment from the Segment Gallery or create a custom one.
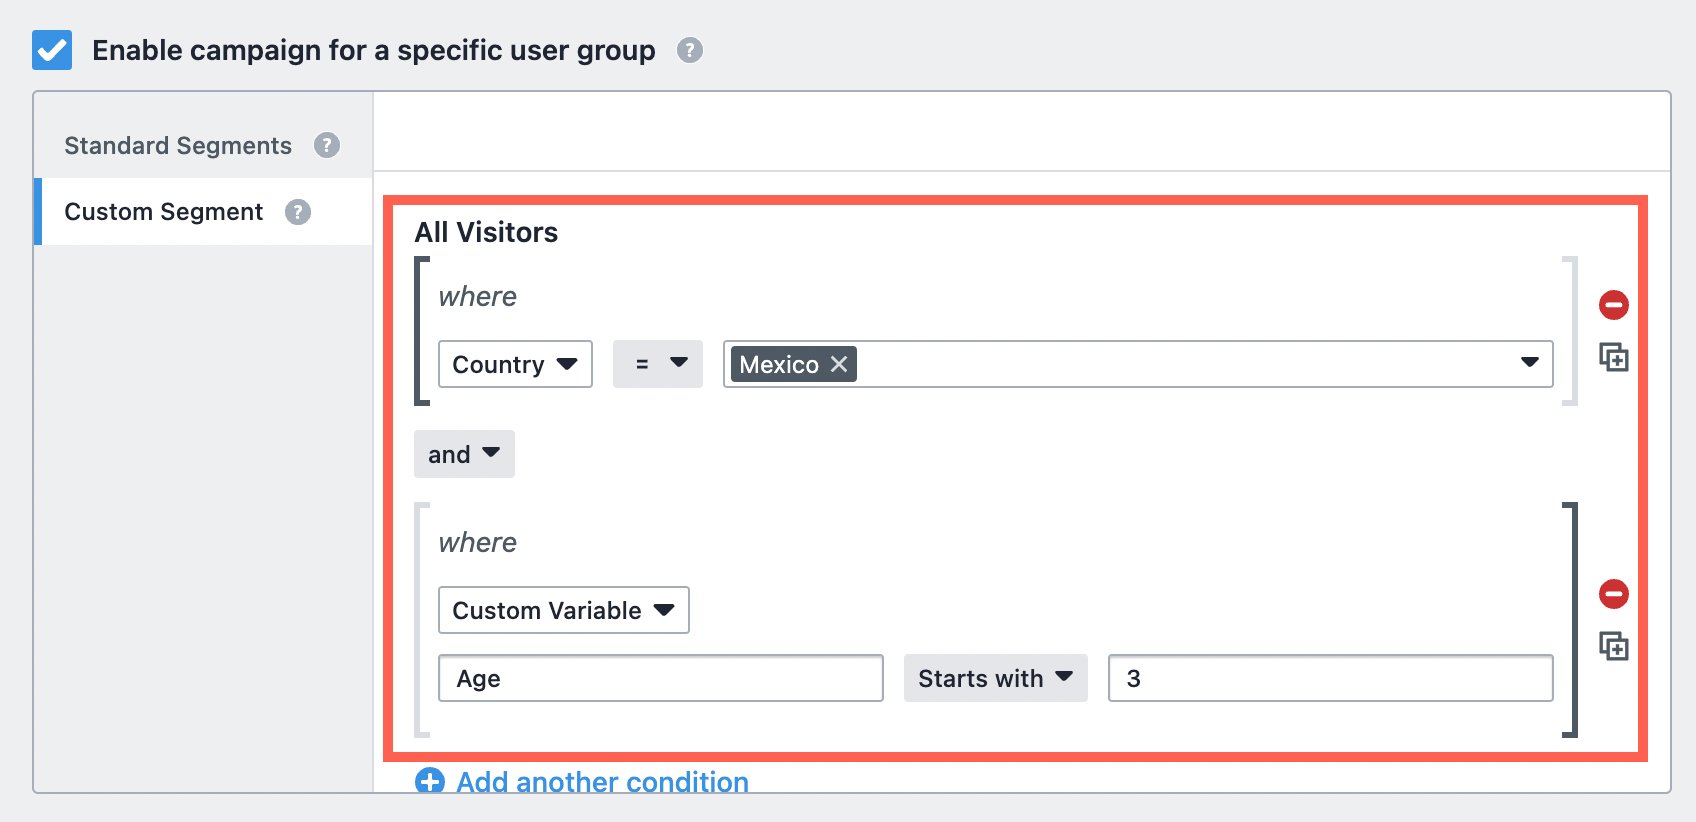
In the context of the previous test example, suppose user research indicates that users are averse to entering their email and password and prefer more flexible login options. Based on this research, you could first target users in a slow market, say Mexico, to see if offering social login options generates a positive response and increases the number of users completing the first onboarding step. To accomplish this, you can go to custom segments to add conditions and select the corresponding attribute (Country) and value (Mexico).
Further, you can use ‘AND/OR’ operators for more precise audience selection. For example, suppose your learning application targets primarily mid-career professionals in Mexico. In that case, you can choose the custom variable option and enter ‘Age’ in the name field and an age group (such as 35-45) in the value field. Then, you can select the bracket on both sides and choose the ‘And’ operation. Alternatively, if you want to track the performance of any one of the groups, you can use the ‘OR’ operator in audience selection.
Here’s a short article on custom segments if you want to learn more.
4. Pricing experiments
Offering discounts or coupons are necessary to boost sales and attract customers to your app. But how can you be sure your pricing strategy is helping your business grow?
Setting prices too high may drive customers away, while setting them too low could mean missing out on revenue.
Metrics to track
To determine if your pricing is effective, analyze the following revenue-related metrics for your app:
- Lifetime value – Revenue generated per user from the time they’ve installed your app
- Purchase frequency – The average number of purchases your users make in a given time.
- Cost per install – prices paid to acquire new users from paid ads.
These metrics can be configured in VWO. If you believe the numbers are not up to your expectations, it may be time to consider A/B testing pricing plans. Doing so can help you maximize revenue without risking losses.
Examples that you can try
Example 1 – Giving a discounted annual pricing to subscribers
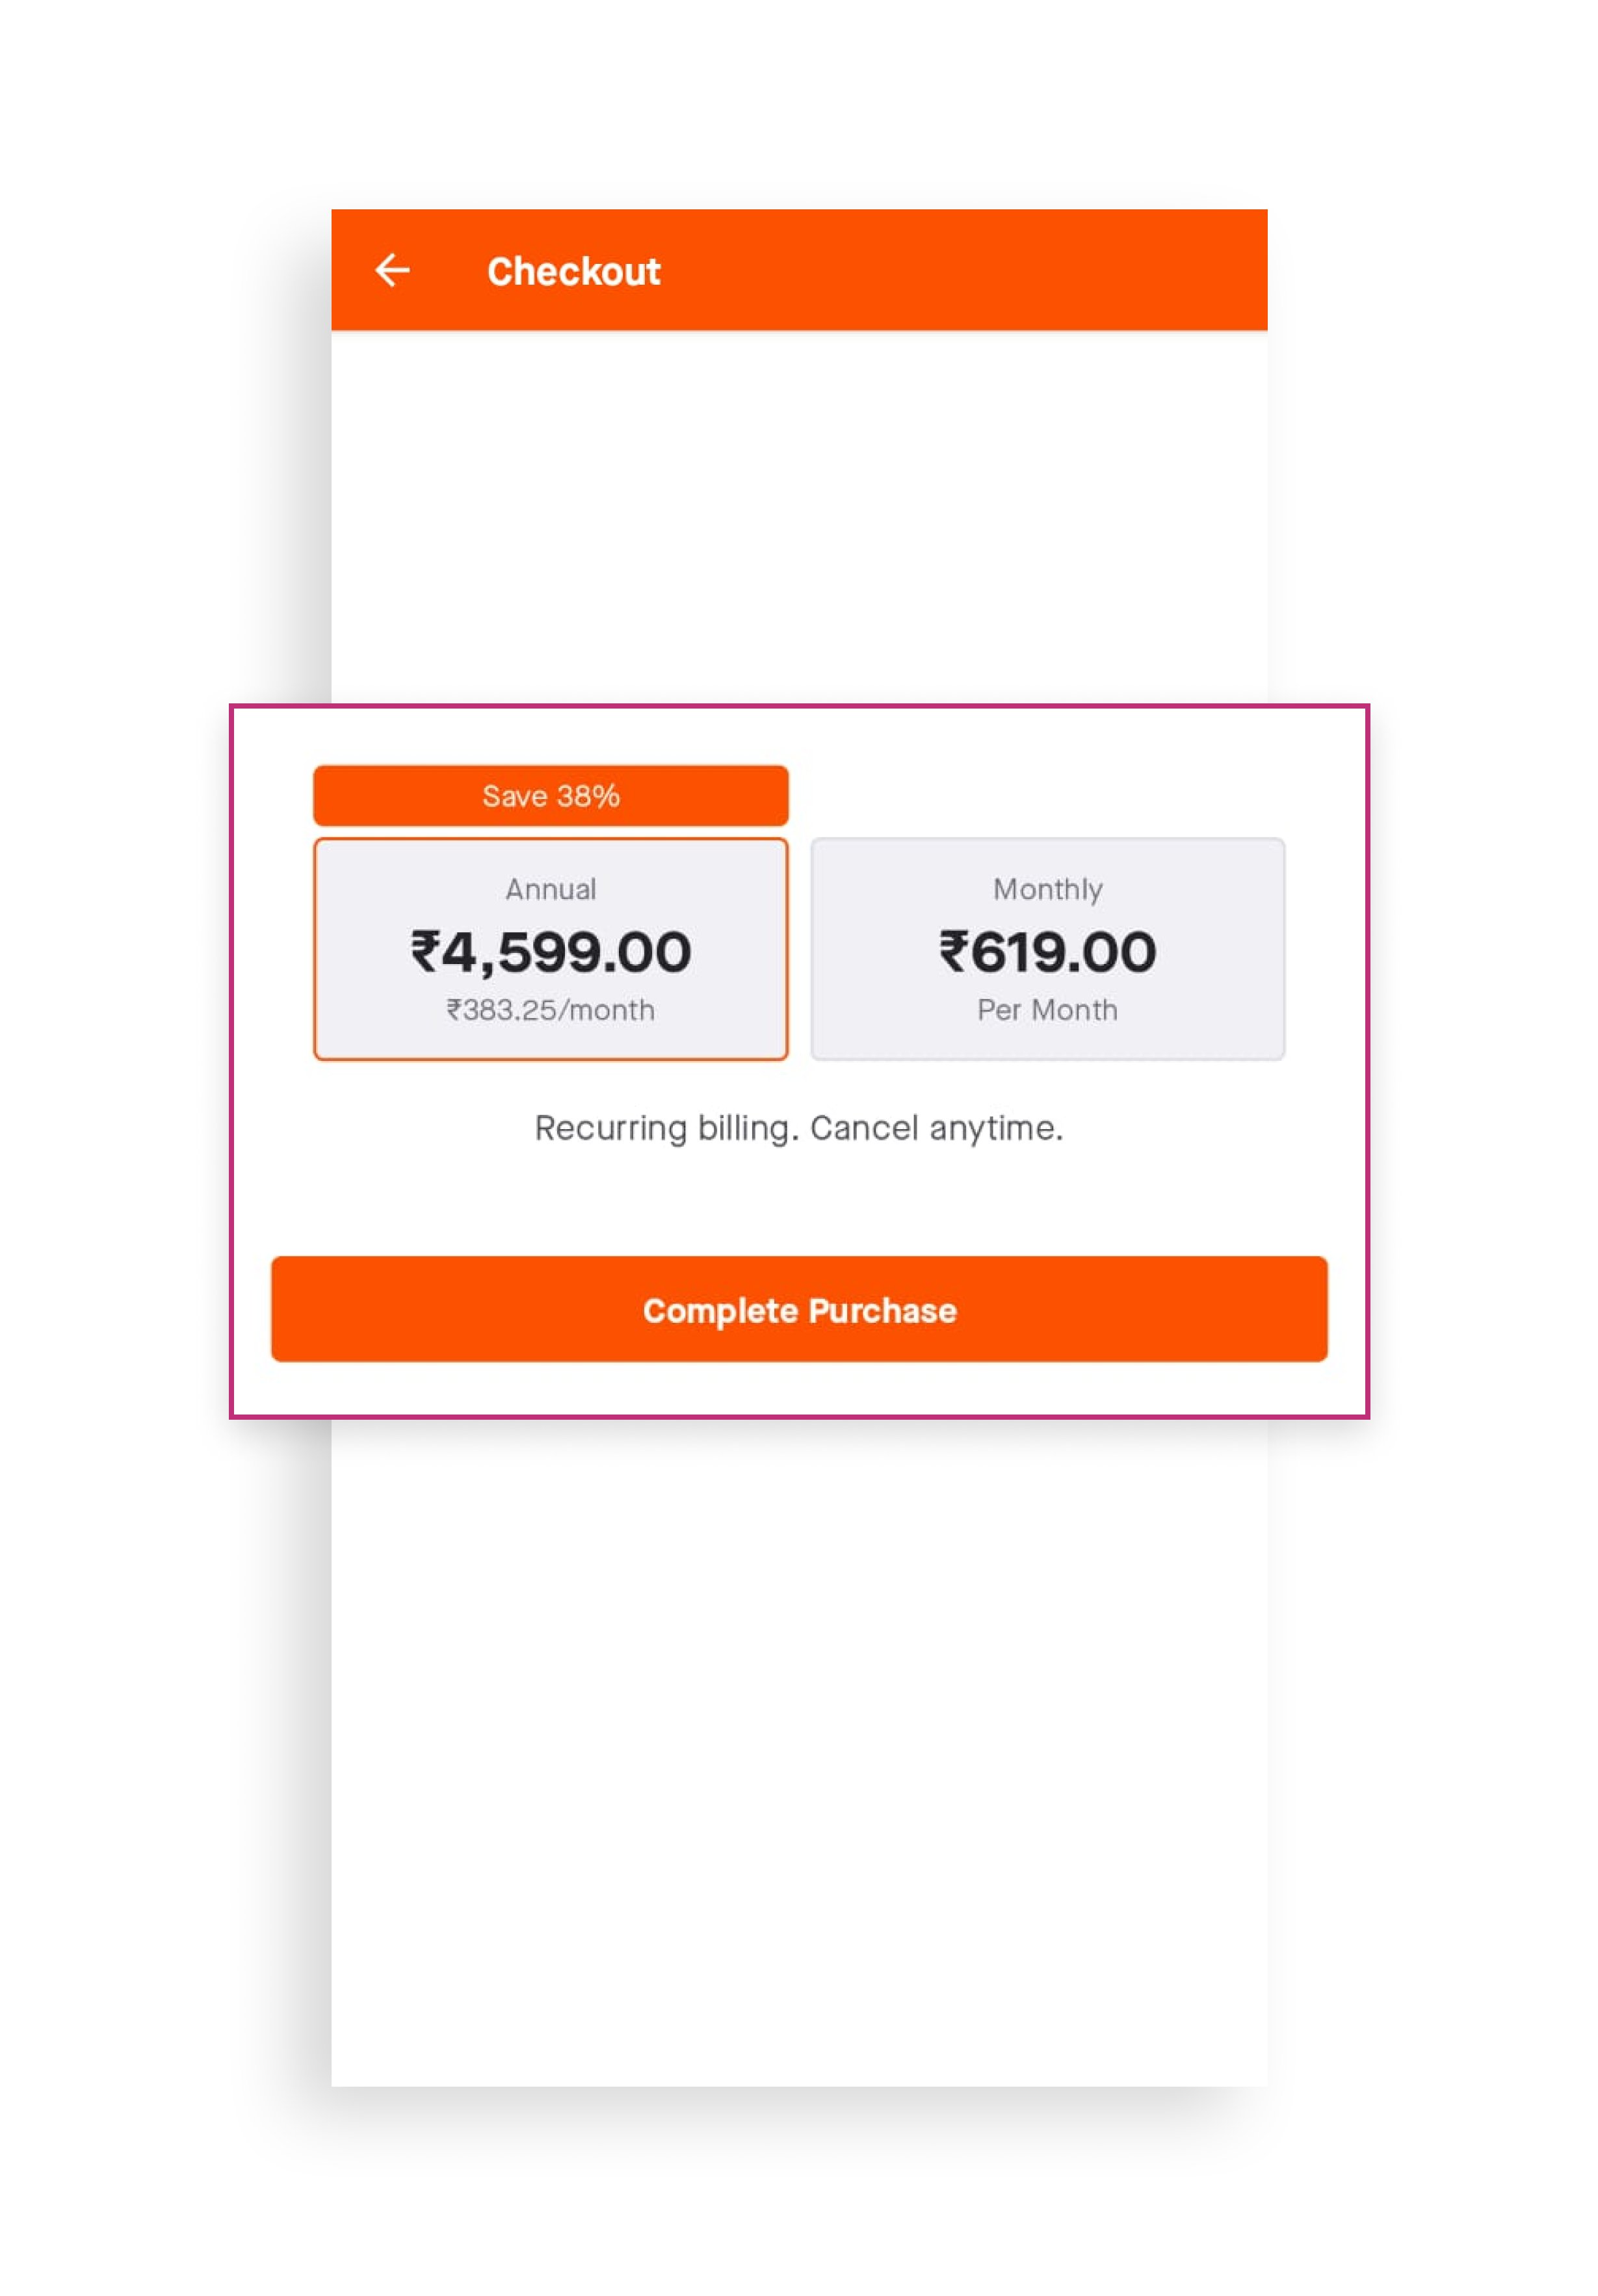
Strava, a popular fitness app, requires its users to pay monthly or annual subscription fees to access its advanced features. Customers can choose between monthly or yearly billing cycles, with the potential savings mentioned for the latter. This discount may incentivize users to opt for the annual plan.
Example 2 – Displaying dynamic pricing with a time limit
Heads Up! is a popular game where players hold a mobile device up to their forehead and try to guess the word or phrase that appears on the screen based on their friends’ clues. Notice how the original price is crossed out, and a time limit is displayed to create a sense of urgency and encourage users to act quickly.

You can create effective app tests based on these pricing display methods.
Tests that can be devised
Let’s say you want to increase the number of transactions/paid subscriptions on your app. The following are the test ideas you can experiment with.
Test 1 Idea
Hypothesis 1: Showing potential savings for a subscription plan will encourage users to opt for the longer one.
Control: Monthly subscription plan and annual subscription plan.
Variation: Monthly and yearly subscriptions have potential savings for both plans mentioned.
Test 2 Idea
Hypothesis 2: Psychological tactics like urgency and striking out the original price can increase the number of users opting for this discount offer.
Control: A simple discount banner with a new price written out.
Variation: A vibrant discount banner with the original price struck out, the discounted price displayed, and a timer indicating the availability of the offer.
Let’s explore a more advanced approach called the multi-armed bandit (MAB) for one of the experiments we discussed earlier, such as the discount test inspired by the Heads Up example. Unlike the A/B tests we previously discussed, the multi-armed bandit approach is a bit more complex and involves a different methodology.
Suppose you have a time-sensitive discount offer with multiple variations to test, and you need to identify the best-performing variation as quickly as possible to minimize opportunity loss. Unlike A/B tests focused on determining the best variation, MAB focuses on getting to the better variation faster. When the optimization window is small, MAB is more suited to minimize opportunity loss in pricing, discounts, subscriptions, etc. In such cases, visitors who are served the second-best variation and don’t convert constitute lost revenue opportunities since they may have converted if they were part of the winning variation. You can learn more about MAB on VWO here.
Accelerate your app success with awesome testing ideas!
We hope you found the A/B testing ideas discussed in this article helpful. However, great ideas are only beneficial when implemented correctly. So, if you’re looking for a platform that offers comprehensive functionalities like light-weight Android/iOS SDKs, 24*7 tech support for multiple languages, the ability to select custom audiences for tests, and gives you reliable, real-time reports, VWO Mobile App Testing should be your top choice. Further, with the full release of Mobile Insights quickly approaching, you can gain a more in-depth understanding of user behavior, improve conversion metrics, and, most importantly, enhance the overall user experience of your app. Request a free demo to see how VWO improves your mobile app users’ journey.
]]>Running experimentation programs is an art and a science. I say it all the time. Programs should have some level of rigor – meaning systems, processes, and procedures. It’s not something to take lightly. Believing that anyone can start a program tomorrow with minimal preparation and planning is a mistake. Unfortunately, though, that happens all the time. It leads to lots of money, time, and effort wasted – unsurprisingly. This leads me to the topic of preparation.
If you want to be serious about experimentation and level up how competitive you are in the marketplace, you better be doing it well. You should assume your competitors are doing it well. So if this resonates with you, continue reading and I guarantee you’ll pick up a golden nugget or two to use immediately.

The unavoidable precursor to building an experimentation program that will make or break you: Pre-test calculations
Pre-test calculations. Ever heard of them? Have you done them? Does MDE or minimum detectable effect sound familiar? How about duration estimates or sample sizes? I hope you know what I’m talking about although I’d bet money that a large majority of you don’t – simply because of my own personal experience with clients.
Before you do anything related to experimentation, please see if you have enough data volume to do it. See if you’re able to test at all through pre-test calculations. By data volume, I mean visitors and conversions. Visitors can be whatever you typically use (e.g., sessions, users, MAUs, etc.). Conversions are from the primary metric you’re going to use in your tests. Know this:
- Not every business has enough data volume to do experimentation at any capacity.
- If you can do it, know that you don’t just pick your desired velocity out of thin air. It’s based on calculations.
The #1 culprit for ignoring one or both of these points: sales people. If you’re looking at buying any kind of tool, make sure this is part of the conversation. The minimum barrier to entry to have an experimentation program: enough data volume to run one test within eight or fewer weeks in one swimlane.
I covered this topic in detail a few months ago for Experiment Nation. Know that if you don’t understand this topic and do it from day one, it will haunt you and definitely cause undesired outcomes of some kind eventually. One other very important note: know if your testing tool (or the one you plan to use) is built based on fixed-horizon testing or sequential testing. This affects the calculations and how you run your program.
Step 1 (Post-precursor): Measurement & data quality
If you’ve cleared the pre-test calculations hurdle and you’ve confirmed that you do have enough data volume to test, the next hurdle to moving forward is measurement and data quality. You must know what you’re aiming at in this work; otherwise, you’ll flounder like a fish on a riverbank. Too many teams don’t know what they’re working toward – like form submissions, transactions, revenue, LTV, etc.
Understand what your primary, secondary, and tertiary metrics are for experimentation and the business as a whole. Understand it with complete clarity. Don’t allow for lingering confusion or uncertainty. Make sure everyone is on the same page.
Then, once you have that much, make sure you’re collecting that data in the right places and that you can trust it.
If measurement and/or data quality are disasters, just stop. Stop everything and devote all of your efforts toward getting it right. Think of experimentation as a pyramid. These two things are the foundational layers of the pyramid. If it cracks at any point in time, everything else will crumble on top of it. I promise.
I’ll say that I know these can be hard. Getting them right can take extra time. Maybe even more than a month or two. Getting them right is worth it though. I’ve seen issues come up six months or more after launching a program – only for everything to eventually come to a screeching halt. No one is happy at that point.
A note on what a primary metric should be…
This is a divisive topic among practitioners sometimes. I have a very firm stance on the matter, specifically when it comes to marketing teams and websites (not necessarily product teams and products).
Primary metrics should always be down-funnel metrics. Orders. Form submissions. MQLs. Revenue. LTV. SQLs. You get the idea. Some people say they should always be the action closest to the change you’re making or engagement metrics. Wrong. No. Nope. Incorrect. BS. Whoever tells you this should be the one to have to justify the program in six months or a year to the CMO or CEO of the company. They’ll be in the hot seat. DO NOT have a program full of tests focused on button clicks, click-throughs, pageviews, avg. session duration, exit rate, bounce rate, video views, and so on and so forth. That’s not going to justify the thousands or hundreds of thousands of dollars spent to do this work. Everyone wants to know their ROI and how the work impacted the bottom line. Button clicks aren’t going to do that.
I’m not saying don’t measure engagement metrics or higher-funnel metrics, but they should be secondary or tertiary metrics. Not primary ones. They add context to the story of a test. They’re not what tests are hinged on when the time comes to make a decision. Note, I’m also not saying there are never exceptions. Still evaluate tests on a case-by-case basis.
A word of advice: To those debating this topic amongst yourselves, I always tell teams to discuss the options and decide for themselves. Just make sure you come to a collective conclusion that everyone abides by moving forward.
Step 2: User research & ideation
At this point, you should (1) know you have enough data volume to test and (2) know what you’re measuring and that you’re collecting proper data that you can trust. So what’s next? It’s coming up with what to test. What are your test ideas? How are you going to generate them?
Guess what most teams do? They go off of gut feelings and a lot of “we think,” “we feel,” and “we believe.” That is far too subjective, and it’s a terrible way to run a program. That approach is not data-backed at all. It’s what practitioners call “spaghetti testing” AKA flinging stuff at the wall and hoping it sticks. Data-based conversations don’t involve much of that sort of language, and the data that’s needed comes from user research. I get asked what “research” means all the time.
Well, there are several methodologies that collect data including but not limited to analytics, polls, surveys, user testing, message testing, heatmaps, session recordings, card sorting, tree testing, customer journey mapping, personas, and many more. There are also several tools to help us complete each of these. I always say to start with one or two and work your way to other ones from there. That’s certainly better than nothing. Technically, I don’t really count analytics anymore because every company has analytics data these days. If you don’t have that, you likely have bigger fish to fry. If you do have it though, strive for one or two beyond that even (and don’t say “oh we’re good then”).
There is a methodology called heuristic evaluation. That’s when someone visually assesses an experience and develops insights based on their experience and expertise. There’s a time and a place for it but it’s not backed by “hard data” most of the time. It’s quite subjective and will be different to some extent depending on who completes it. Know your program shouldn’t be based on these types of insights.
I’m not going to cover how to do research in great detail here, but you can check out one of my VWO Webinars here where I talk more about CXL’s ResearchXL model.
Step 3: Prioritization
Once you have a list of test ideas, you can’t do them all at once. You need a strategic, logical way to create an action plan. This is where prioritization frameworks come into play. Many exist. I like one in particular: the PXL framework from CXL. Other common ones include PIE, ICE, or PILL. The PXL is the most objective in my opinion. It’s customizable and more robust (in a good way).
Other models are okay and better than nothing. If you have something and it’s working for you, great. Just have one and make sure everyone is using it! It saves you from dealing with extra chaos.
Step 4: Roadmapping
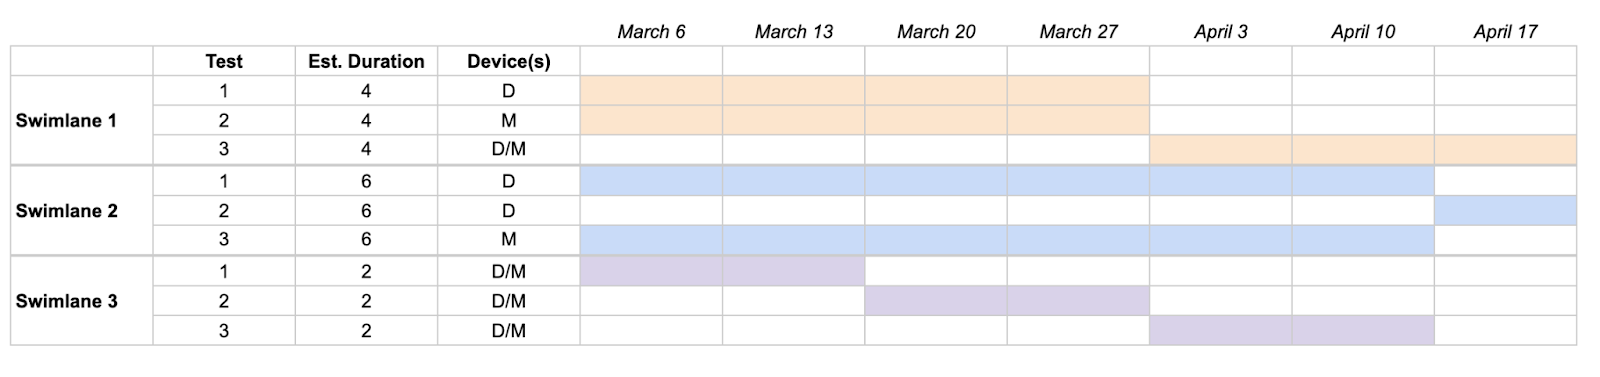
Roadmaps visually show you what’s running at any given time. Combine your prioritization and pre-test calculations and boom. You’ve got a roadmap. These are best done in Gantt charts. Add all of your swimlanes and tests with estimated durations, devices, and other helpful metadata. You’ll avoid unwanted overlap and unwanted interaction effects. It helps everyone plan much more effectively and efficiently. This will save you from more chaos.
Step 5 and beyond: Business as usual
Now that all of what we’ve covered is out the way, it’s business as usual. You have a test at hand that you’re going to run. You send it through the regular experiment workflow: mockup > design > development > QA > launch > monitor > conclude > analyze > share and archive > repeat.
Related topics: Program management & governance
Outside of individual tests, there are other topics for consideration in relation to an entire “program.” These include program management and governance. Here’s how I think about them in a very boiled-down way…
Program management: How are you going to organize and keep track of all of this work? Figure out what tools you’re going to use for tasks, data management, and communication. (I got that breakdown from Ben Labay, CEO of Speero.)
Governance: What roles and responsibilities does everyone have? A helpful way to determine this is to (1) choose a governance model and (2) complete a RASCI chart aligned with the governance model. Common governance models to investigate and consider: Individual, centralized, decentralized, center of excellence, testing council, and hybrids.
If you don’t nail down both of these with everything else, it’ll be additional chaos and you’ll pay for it every step of the way. Nail these down. It takes extra time, but it’s worth it. If you hack your way through things for a while, the consequences will catch up with you eventually. I promise. (Apparently, I have made quite a few promises here.)
Conclusion
You should feel a little (or a lot) more confident in what you can do to get started in experimentation or what you can do to level up your program that’s already running. Don’t feel it’s too hard or too easy. It’s usually somewhere in the middle. My biggest recommendation applicable to everything I’ve mentioned: Have a quarterback. Have someone that leads all of this work. It doesn’t have to be their full-time role, but someone should own it. That’s usually when I’ve seen the most success.
To wrap up, I hope you have an experimentation program full of rigor, results, and a little fun sprinkled in. At the end of the day, it’s fun and exciting work that can make a huge difference for a business.
If you would like to know more about how experimentation drives innovation and growth and is worth all the hype, watch my latest webinar with VWO.
]]>Businesses don’t wish for users to have a hesitant conversation about their product. Unfortunately, most free trials don’t hold true to user expectations. You sign up for a free trial, but some capabilities are always gated, making it difficult to fully evaluate a product before investing in it.
At VWO, we realize that users need to understand how a product and its capabilities fit into their workflow, whether they fulfill important business objectives, and satisfy relevant use cases. That’s why, with VWO, you get a 30-day free trial that includes all offered capabilities. The allotted visitor quota that comes with each capability gives sufficient time and bandwidth to experience all the benefits that VWO can bring to the table.
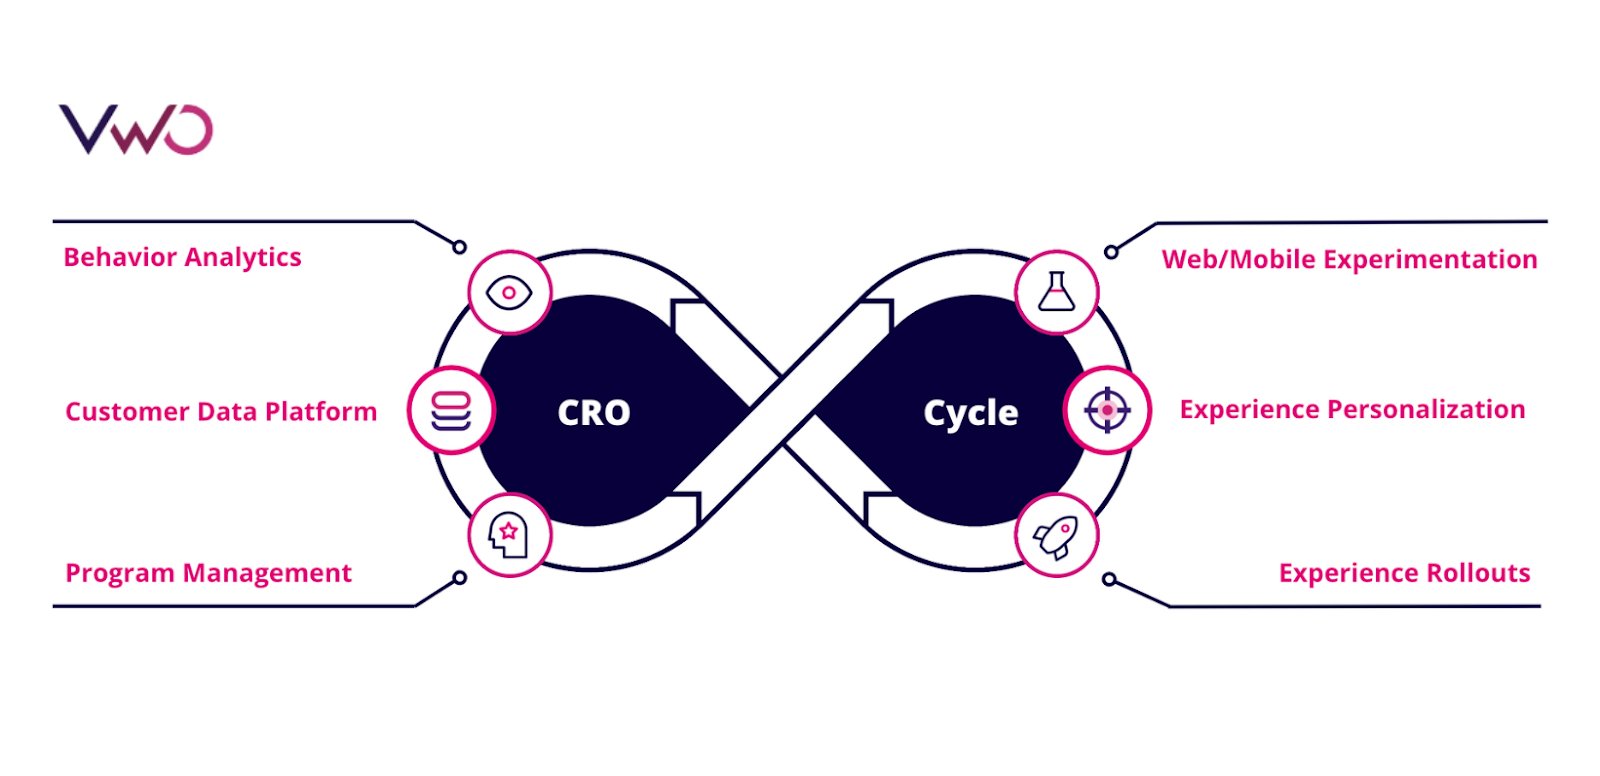
Experimentation is a continuous and interconnected process with data as its backbone. As shown in the loop diagram below, VWO’s suite of capabilities includes everything needed to run experimentation and personalization end-to-end. The free trial gives you access to each of these capabilities.
This blog answers questions that you may have about the free trial and explains what is included, how to access it, and the next steps.
1. Behavior analytics | VWO Insights
The process of experimentation starts with analyzing visitor behavior. With VWO Insights, you can analyze visitor behavior and identify bottlenecks in your current flow. Here is what you can do during your free trial:
- Goal setting to track the performance of pages and elements. You create pages and elements on a website with a specific purpose, and tracking how they perform is necessary. With VWO Insights, you can track the following:
i. Page visits to know the number of unique visitors who visit a page.
ii. Click on links to gauge the click-through rate of links, URLs, and URL patterns.
iii. Click on elements to track clicks on menus, videos, images, and other elements.
iv. Form submission to find the number of successful form submissions.
v. Revenue to track the earnings generated from each successful conversion.
vi. Custom conversion goals that are business specific.
- Funnel tracking to visualize the visitor journey and know where they drop off. Funnel visualization, in combination with heatmap and session recording, allows you to know why visitors are converting or losing interest. For example, the following is a funnel overview of the lead generation journey in VWO.
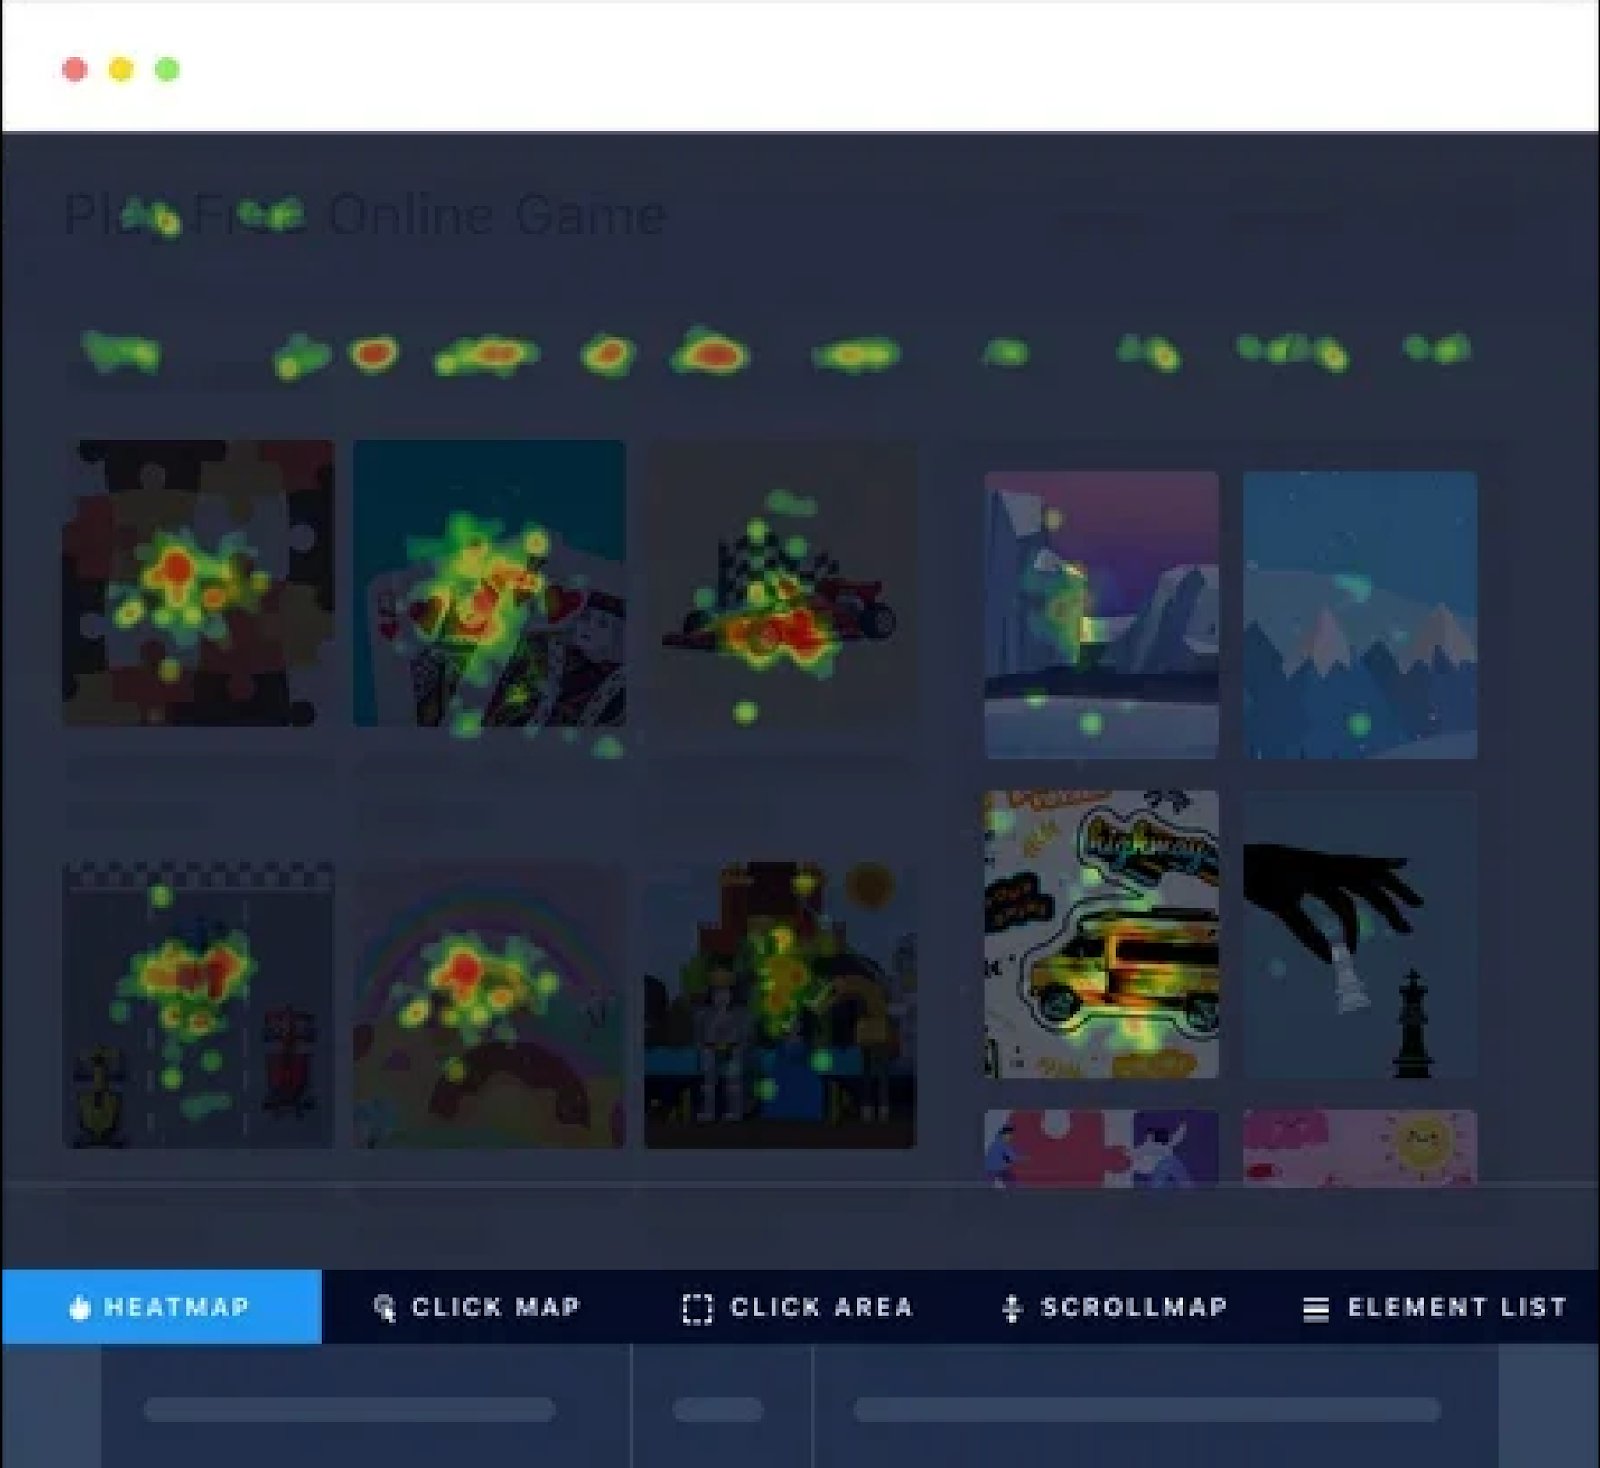
- Heatmap tracking offers a comprehensive real-time view of website visitors’ movement and behavior. You can gain insight into how website elements are perceived with features such as dynamic heatmap, clicks-map, scroll-map, element list, and click area.
- Session recording to record visitor interaction for a single page or the complete website. You get to view the mouse movement and clicks to know how visitors engage with the overall website design, CTA position, content, and other aspects. With session recording, you can know the difficulties faced by visitors.
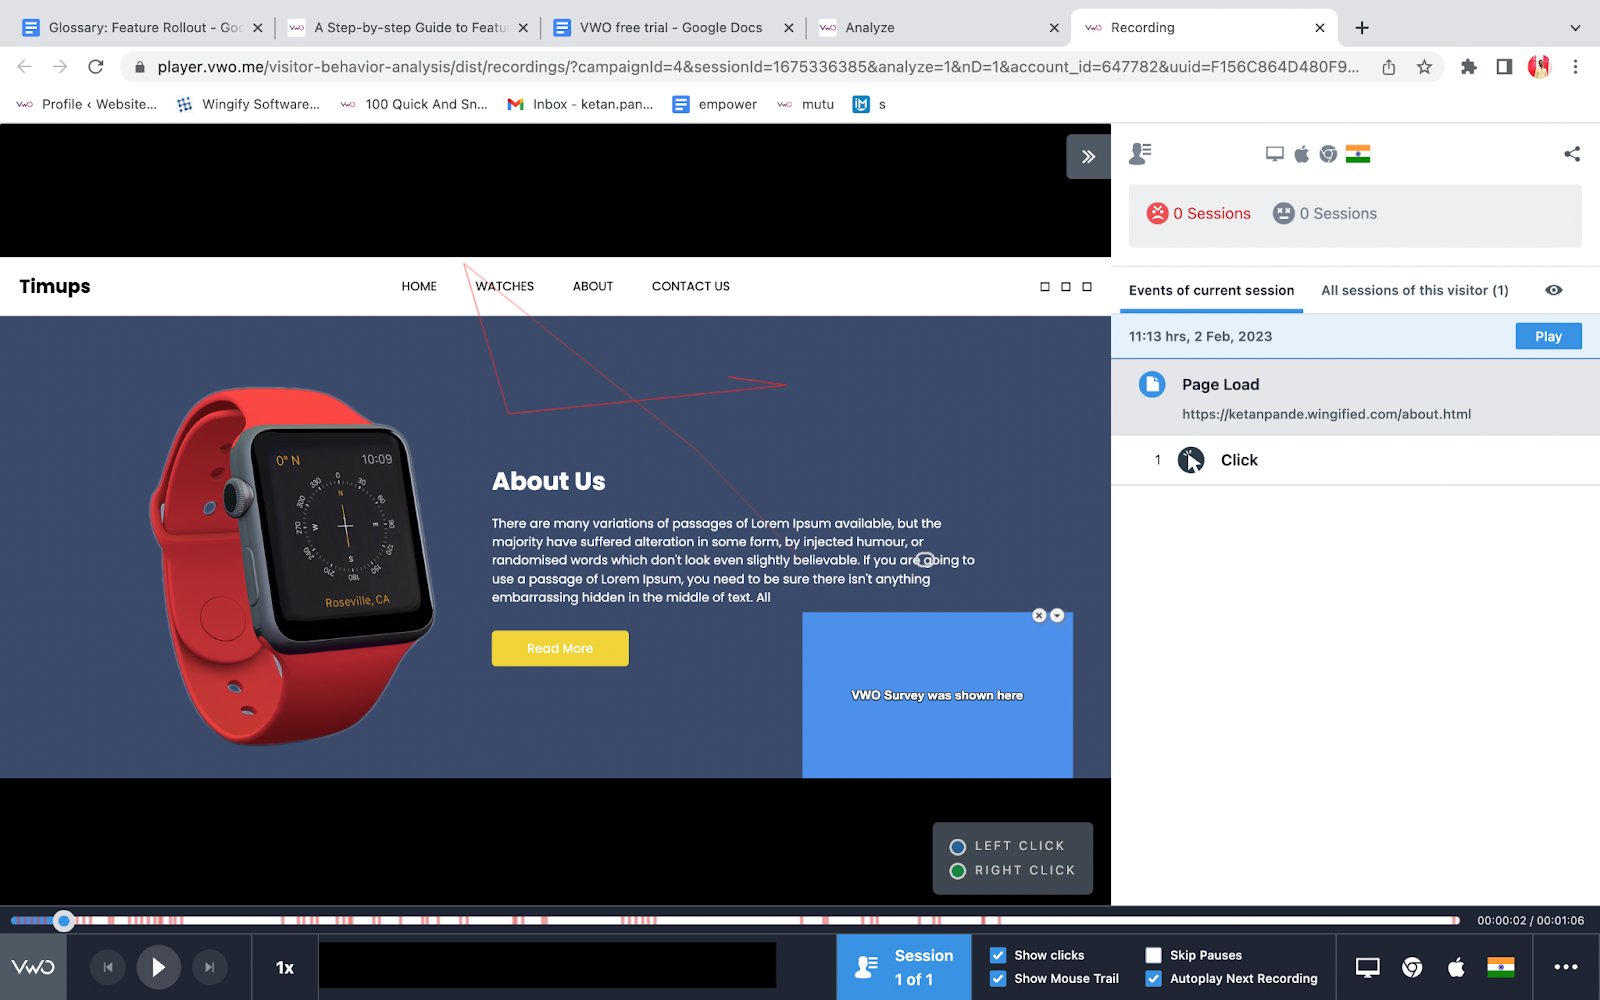
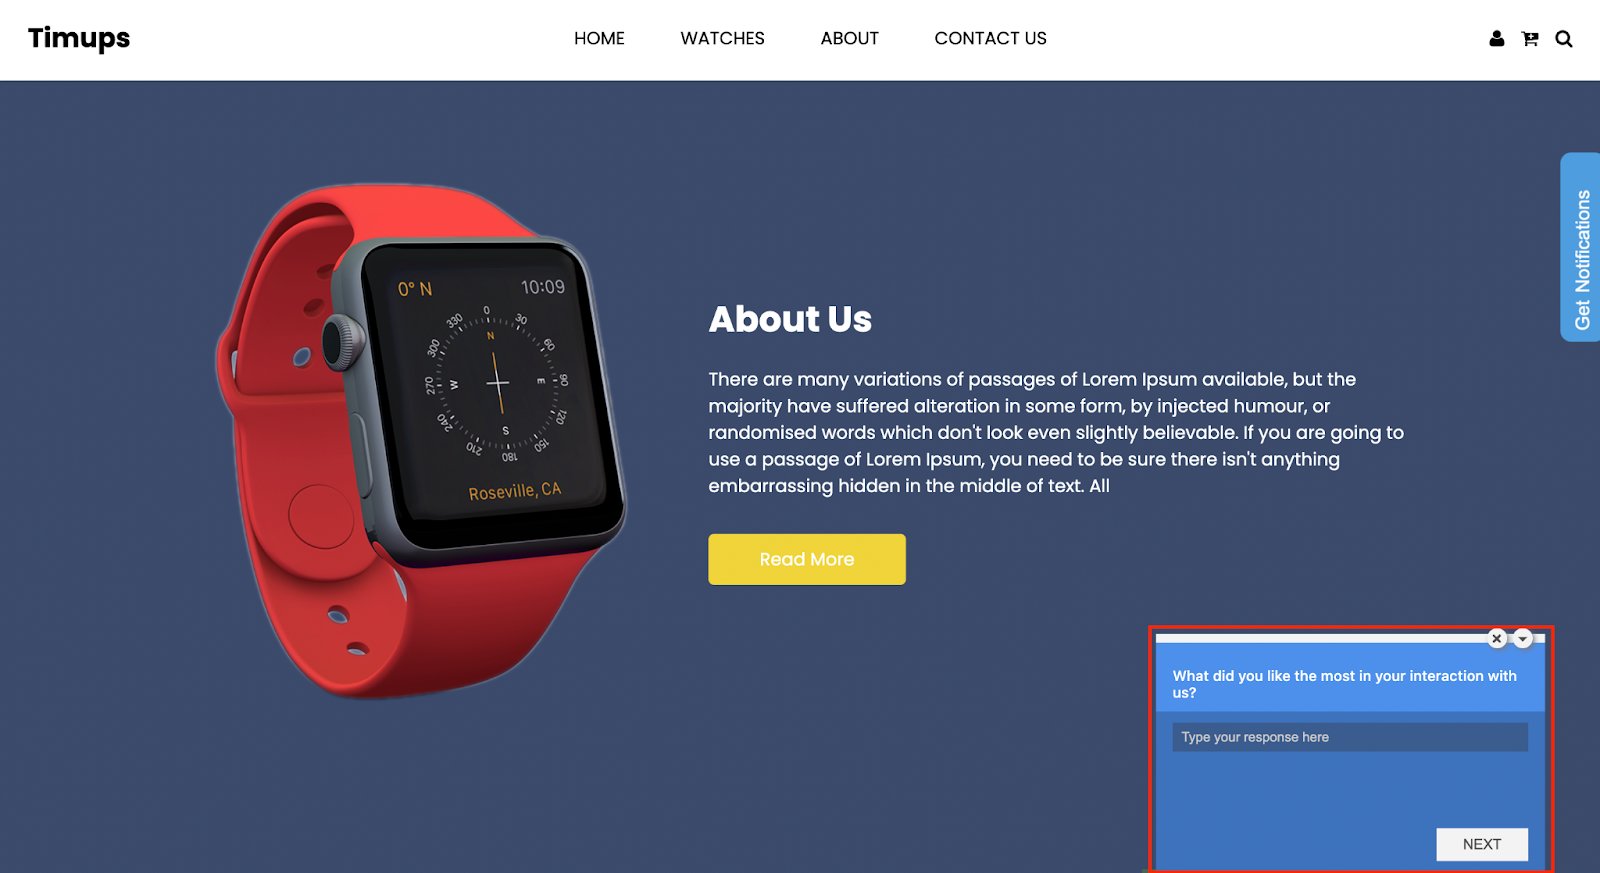
- On-page survey to collect visitor feedback on website experience. The survey can be triggered based on specific events like when the visitor lands on the check-out page and can be targeted for specific visitor segments. You also get the option to view session recordings of the survey to scrutinize its performance.
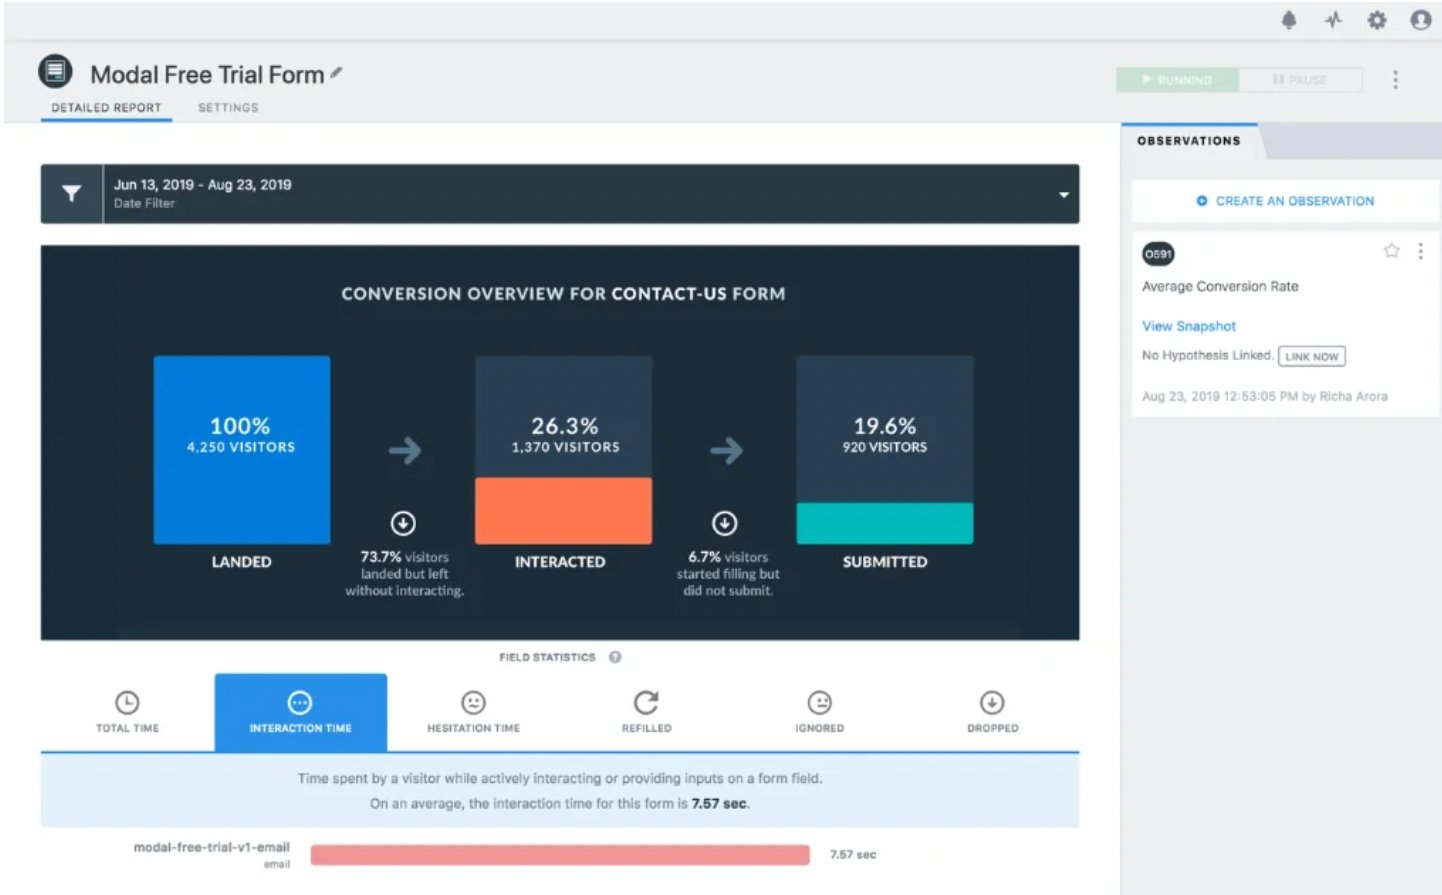
- Form analytics to analyze the performance of all types of website forms. Form analytics helps understand visitors’ interaction with your forms and the factors that lead to drop-off. You can identify which fields caused the most confusion, took the most time or needed the most revisions for the visitors.
Note: Except for the survey, visitors are sampled uniformly for tracking and analysis for all other products in the insights. You can read more about the sampling logic of VWO. When signing up for the free trial of VWO Insights, the visitor quota is allocated based on your website’s monthly traffic. You can select from the following options during the free trial sign-up process:
| Selection | Allotted Quota |
| Upto 10K | 10K |
| Upto 50K | 50K |
| Upto 100K | 100K |
| Upto 200K | 200K |
| Upto 500K | 500K |
| Upto 1M | 500K |
| More than 1M | 500K |
| I am unsure about my visitors | 100K |
2. Web experimentation | VWO Testing
Once you have gathered visitor behavior insights, you can form hypotheses for running tests. You can perform A/B testing, Split URL testing, and Multivariate testing with VWO Testing to optimize the website for various marketing objectives. Here is what you can do with VWO Testing:
- Define specific pages, URLs, and URL patterns for the test. Segment visitors for testing based on visitors’ interests, demographics, or any custom characteristics.
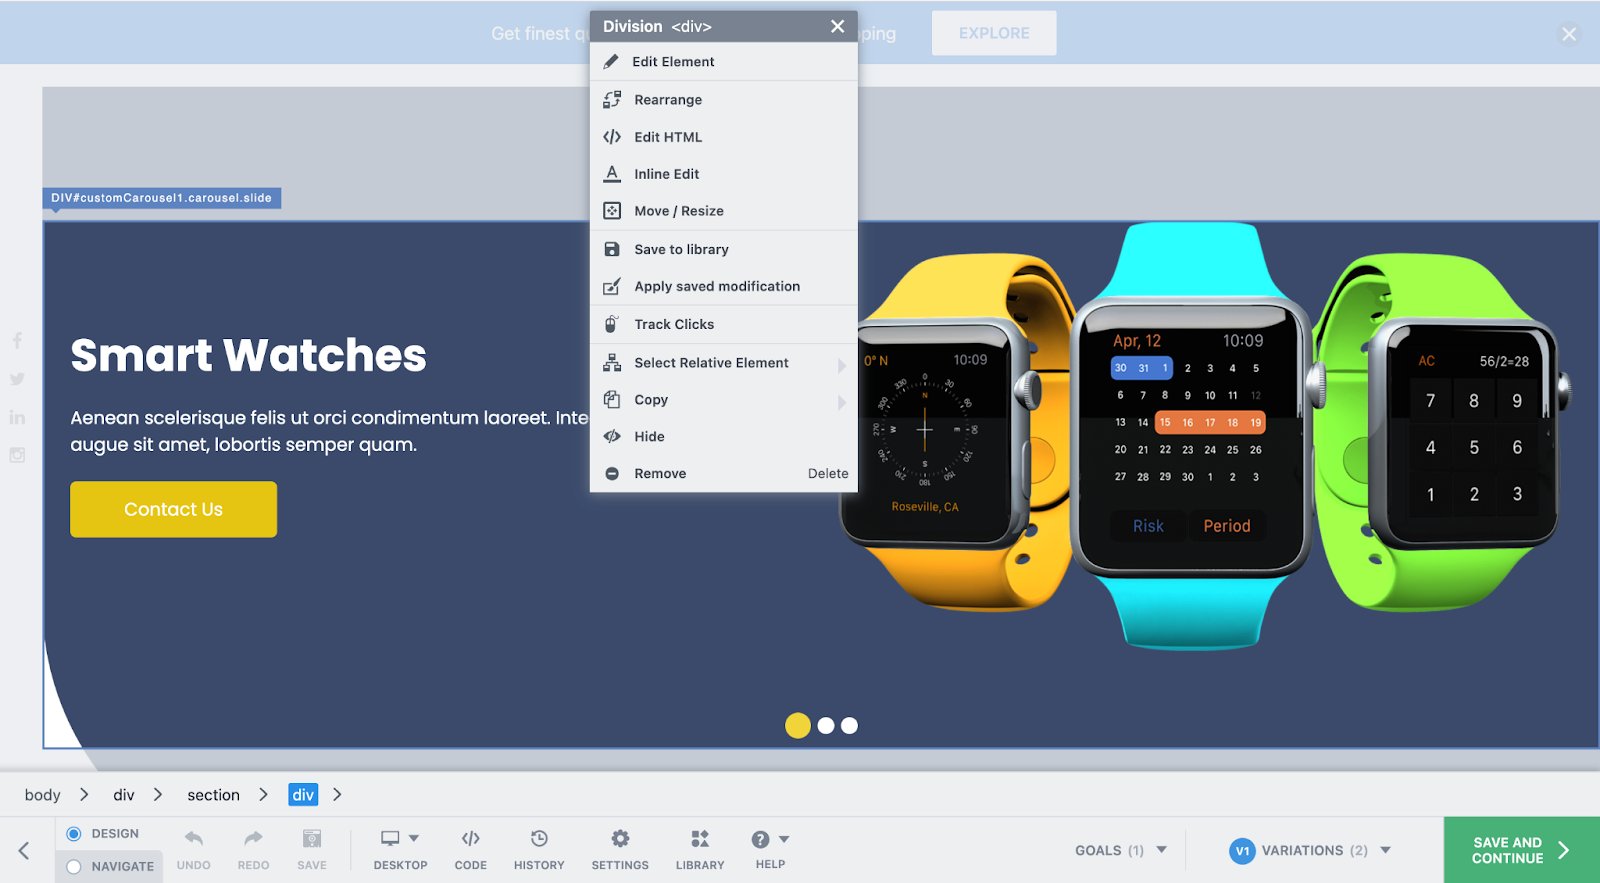
- Modify elements, embed media, and add widgets and dynamic text to create variations for A/B and multivariate tests with a drag-drop editor. Also, your development team can use an inbuilt code editor to make complex changes.
- Set goals for page visits, engagement, form submissions, clicks on links and elements, revenue, or a custom event.
- Allocate traffic to variations, integrate third-party apps for data transfer, and create mutually exclusive groups for similar tests, such as two A/B tests with different product prices.
- Get real-time reports that are easy to understand and equipped with over 20 predefined segments, like new or returning visitors, devices, location, etc., for detailed analysis. Additionally, you can compare the behavior of two segments, such as visitors exposed to a special promotion and those who were not.
Additionally, you get to,
- Tailor variations for particular devices or uniformly implement them on all devices.
- Organize your testing program with ease using the Kanban board, providing a clear and comprehensive overview of your entire testing pipeline. It enhances accessibility and transparency.
- Record learnings from past tests so that all teams can build better hypotheses and test them in the future.
- View the heatmap and click map for variations and control.
In the free trial, you get a quota of 10K visitors for VWO Testing. A unique visitor can become part of multiple tests but will be counted only once. Also, it is important to note that only visitors who become part of a campaign are counted and not the complete website traffic.
3. Server-side experimentation | VWO Fullstack
There are multiple use cases, like search algorithm testing for instance, for experimenting on the server-side to avoid flicker and ensure zero latency. You can perform server-side testing to test complex ideas with VWO FullStack. Here are the capabilities that you can explore:
- Run experiments and launch new features across multiple channels, such as web, mobile, email, etc.
- Test different variations of a product’s features, functionality, design, and pricing.
- Release new features to a small group of visitors or even to a production environment without releasing them to the entire visitor base.
- Connect the data sources with the popular tools used for data storage, business intelligence analysis, and customer data platform.
- Get advanced reporting and identify instances like a group of visitors demonstrated a substantial deviation in conversion rate compared to others for a particular objective or variation.
We offer an assisted free trial for VWO FullStack that includes backend installation and initial campaign setup. Also, you get a quota of 10K visitors per month in the free trial.
4. Mobile app experimentation | VWO Mobile App Experimentation
You can also use VWO Mobile App Experimentation to optimize your in-app experience. Here is what you can do:
- Test everything from simple CTA button changes to complex app flow.
- Measure ROI, and identify conversion triggers.
- Test new app features on a selected audience before making it live for all app visitors.
We provide an assisted free trial for VWO’s Mobile App Experimentation that includes backend installation and initial campaign setup. Also, you get a quota of 10K visitors per month in the free trial.
5. Personalization | VWO Personalize
You can tailor visitor experiences with VWO Personalize based on visitors’ past data. Your visitor data is secure with strong privacy and security protocols. Here is what you can do with VWO Personalize:
- Create personalized experiences for different visitor groups with a WYSIWYG Visual Editor.
- Monitor the performance of personalization efforts and assess their impact on different visitor segments with a central platform-level metrics system.
- Integrate third-party analytics tools, CMS, CDP, and ABM to fill lacking visitor information and understand customer behavior to create complex customer segments.
Similar to VWO Testing, for VWO Personalize free trial account, you get a quota of 10K visitors. A visitor can become part of multiple personalized campaigns and will be counted only once.
6. Rollout | VWO Deploy
Once you have your experimentation results, you can choose to push your winning version live using VWO. VWO Deploy allows you to roll out minor changes or revamp the website. Here are its features:
- Drag and drop editor to edit, resize, move, and replace the existing elements, and the option to add widgets. Also, there is a code editor to make complex changes.
- Live preview of the changes on different devices and browsers
- Ability to deploy winner variation from web experimentation.
- Option to roll out new changes to a segment of visitors so that you can release relevant changes as per visitor background and interests. For example, releasing a greetings widget for festive seasons as per geography.
For a free trial, you get a quota of 10K visitors for VWO Deploy. A visitor can become part of multiple deploy campaigns and will be counted once.
7. Customer data platform | VWO Data360
When customer data feeds into the experimentation and personalization loop, it keeps you on the right track. VWO Data360 is a customer data platform that provides a single and coherent view of all customer data. The platform allows data unification that can be later used for segmentation and targeting in campaigns. The Data360 module enables you to create and manage the following features:
- Attributes: Attributes are variables that help identify and segment visitors, including information such as traffic source, browser used, visitor gender, subscription level, and location.
- Events: Events refer to actions taken by visitors on the website, like clicking on an offer banner or making a payment. Each event has a name and set of properties that describe it.
- Metric: With our tool, you can establish and monitor your goals/key metrics for a thorough understanding of your conversions, such as form submissions, page views, and clicks on specific elements.
- Profile: With our platform, you access all the information of a visitor, such as their attributes, events, segment membership, metrics, and behavioral data all in one place. It gives you the ability to perform in-depth analysis and better understand the motivations behind their actions. You can also see data related to VWO Testing, Insights, Deploy, and Personalize campaigns of which the visitor is part
- Audit: It lives streams the website events as a list. It helps to know if the set events are tracked properly on your website.
During the free trial, Data 360 can be used without any monthly set traffic quota. You can track the number of times an event is triggered but not track complex metrics like average order value or total revenue. Additionally, in the free trial, only one numerical property can be set for an event. Custom attributes such as age, gender, etc., cannot be created. Finally, the free trial only allows you to view up to five profiles in user profiles.
8. Program management | VWO Plan
With VWO Plan, you can collaborate with teammates and other teams to prioritize, analyze, and discuss experimentation campaigns. Here is what you can do:
- Store all your thoughts, insights, comments, or ideas related to any aspect of your experimentation program in a centralized database.
- Capture behavior data and record your observations from VWO Insights. You can use these observations to document and prioritize experiment ideas on the Kanban Board.
- Prioritize and execute testing ideas from a shared dashboard.
- Track key business metrics and monitor their changes over time with ease through the experimentation program.
In the free trial, you get full access to VWO Plan.
FAQs on VWO free trial
You can create your free trial account here.
You can use VWO with all features and capabilities for 30 days.
You get a live demonstration of the product with self-learning videos to understand its capabilities and dashboard functions.
If you don’t subscribe to a paid plan, the account is deleted after 45 days of inactivity. However, you can export the collected data before the deletion day.
Yes. A free trial account gets email, chat, and phone support for the complete duration. Also, we share some testing ideas with you that you can use to get started with experimentation.
Yes, we offer a VWO Testing – Web and VWO Insights – Web starter pack in which you get free usage. You can learn more about VWO pricing and plans.
Conclusion
In this blog, we have tried to provide exhaustive information on the VWO free trial. However, if you have further questions, please get in touch with [email protected]. Our support team is available to guide you throughout the free trial. Alternatively, you can also request a live demo to see VWO’s capabilities in action.
So, boost your optimization efforts, and grab an all-inclusive 30-day free trial today.
]]>However, once you’ve run tests with winning results, it’s a tad difficult to wrap your head around the failed ones.
Download Free: A/B Testing Guide
But is experimentation all about winning?
If you’re expecting each of your tests to lead to a revenue uplift, you’re wrong, my friend.
The reality is a far cry from it, and you can’t simply expect experimentation to be a magic wand that fixes all your business metrics overnight.
Instead, experimentation serves as a process that helps you find answers to your questions and validate your hypotheses to help you achieve strategic business goals. It is an exercise of trial and terror that takes time and consistency.
If you understand this, that is half the battle won right there.

So, how do you win even when your test results are grim? You win when you change your approach to experimentation and your expectations from it. Below we discuss a methodology that can get you started thinking on this line and focus on the result that matters.
How to learn and improve from A/B test results
Conversion uplifts can’t be guaranteed every time you run a test. So, why would you bother running tests? Why do you think global giants like Amazon, Netflix, and Facebook run tests? Not every test is a winner for them too. The ultimate objective behind testing is to see which ideas can help and which can’t help improve user experience. Testing is an aid in your journey to user experience innovation.
When your focus is on long-term wins, you’ll walk away with great learning nuggets even from A/B tests that don’t look so successful on paper. Below we tell you some steps to adopt a fresh and refined approach to experimentation as a whole.
Brainstorm ideas
Motivate everyone in your organization to contribute testing ideas without staying limited to certain roles and designations. You can get the next best testing idea from someone you never expected to contribute.
Have some winning tests in your kitty already? Share the results with your stakeholders. Show them how optimizing a web form increased freemium subscriptions by 20% or 30% for example. Or if you have a test where you tested iteratively that led to a big winner, share how some tests can be patience-testing yet totally worth the end results.
That way, you will also be able to motivate your team members to take an interest in experimentation and make it an integral part of their work. This mass-level participation is necessary to make a shift towards an experimentation culture.
VWO can assist you in this ideation journey. How? VWO Plan is a useful capability that makes team collaboration a cakewalk. It offers a centralized repository where you can add all notes, observations, insights, and ideas pertaining to a particular test. This facilitates a structured way of building data-backed hypotheses where every team member remains aware of finer details related to all tests.
Plus, you can refer to our checklist anytime to see all the things you need to get right to uphold the quality of your experiments. The more finesse you show in pulling off the tests, the better position you’ll be in to tell your people to follow suit.
Strengthen your hypotheses
Experimentation either validates or refutes your hypothesis. What if your hypothesis is wrong and your status quo is still a strong performer? Is it not a win in a way? You are an A/B test away from validating the hypothesis behind your control and averting the shipping of a bad idea.
Suppose you remove discount code and promo code fields from the checkout page to reduce distractions for users, in the hope of making checkout seamless for them.
But contrary to your expectations you see from the data that removing these fields resulted in an increased drop-off from the checkout page. This will lead you to believe that users might have wanted to avail of discounts and therefore expected to see these elements throughout their journey on the website.
Use all knowledge that you’ve acquired about customer behavior on your website through A/B tests to inform your hypothesis creation process. Going back to our example, seeing your users drop off to search discount codes or compare products on third-party websites in the previous test, you can build a test idea around making such information available on the website to improve checkout and purchase completions.
The key lies in seeing experimentation as an integrated process and not treating every A/B test as a silo.
VWO Plan comes in handy as it allows you to jot observations from user behavioral analysis, create hypotheses based on those observations, and manage and prioritize testing ideas. With all necessary details in one place, you can keep track of all hypotheses through a progress view on the hypotheses dashboard.
Choose the right sample size
To get statistically significant results out of your A/B tests, you must run these tests on pages that get enough traffic. With a smaller sample size, you will have to give your test a lot of time to be statistically significant.
We suggest you sort this out before starting your testing campaign. How to do it? Try the VWO A/B testing calculator. It’s free!
Besides this, founded on Bayesian inference, VWO SmartStats saves you from the hassle of needing a minimum sample size to a large extent. Simply enter the number of visitors and conversions for control and variation to calculate significance.
Get the most out of platform features and capabilities
It’s often seen that marketers don’t utilize all the features on their CRO platforms to their fullest potential.
For example, in VWO, you can use custom dimensions for report filtering post-segmentation. This gives you deeper insights into how different user segments behave in a testing campaign. But if you didn’t know its use case and purpose, you would not be able to unlock the magic it can cast on your CRO KPIs.
If you’ve chosen VWO, you must also know that one of its capabilities is also visitor behavior analysis. You should not restrict yourself to just testing; instead, you must explore other VWO capabilities to take your entire optimization program a notch higher.
Evaluate reports
Free your mind of ‘winning’ when you evaluate your A/B testing results. You must see experimentation as a journey to discover and learn how to optimize the performance of your future campaigns. And deriving great learnings only becomes possible when you read or evaluate experiment results in the right way.
Here are a few questions you can ask yourself after running a test:
- How did different user segments react to the variation?
- Which variations worked the best for existing users or new ones?
- How is this hypothesis different from the previous one?
- Have we uncovered any other testing opportunities for the future?
Answers to these questions should guide your next steps – whether you want to run an iterative test to get more granular-level data or you need to make room for new ideas in your larger marketing strategy.
And if you’re using VWO for your A/B tests, it’s easy to drill down to the details. Not only can you see the performance of all variations by studying specific metrics for each of them, but you can also compare their conversion rates using graphs. Even if your A/B test has failed, you can use the feature of custom dimension to see if this result is consistent across all user segments or if any particular segment has responded favorably to the test. This can form the base of your next personalization campaign too – where you target this specific segment with the changes validated by this test. Since VWO is an integrated platform, all these findings feed into each other and everything is managed via a single dashboard. Take an all-inclusive free trial to see this in action.
Let us explain how custom dimension works with an example.
Imagine, you want to highlight the top brands that have gotten listed and started selling their unisex sneakers on your eCommerce store.
You believe that adding a carousel showcasing unisex sneakers by top brands on your website homepage will pique visitors’ interest in this collection and even nudge them to purchase.
As a result, you want to run a test and track clicks on the ‘Shop Now’ CTA button in the carousel.
However, you see the test has not performed well because maybe the carousel images are not attractive, the radio buttons in the bottom are not prominent, or the CTA copy is not persuasive – the reason could be anything.
But then you decide to slice and dice the report and want to study visitors’ interaction with the element at a granular level. It is now that you see the variation performed better for females between the age of 22-28.
Based on this observation, you can decide to send personalized email newsletters offering discounts or promo codes to female visitors from the said age group that seemed interested in the sneakers. Or you can personalize the landing page with the carousel only for this particular customer segment.
The saying – When one door closes, another opens – comes alive in such situations with the help of VWO custom dimensions.
Companies that adopted the experimentation mindset and succeeded
Learn how Paperstone’s ‘don’t-give-up’ approach to testing increased their revenue
This UK-based office supplies company competes against many dominant and small companies selling similar products. Paperstone used VWO to optimize its website and deliver top-notch user experiences to stay ahead of the competition.
Through a user survey, the company found that their customers and prospects expected bulk discounts. But considering the competitive nature of the business, profit margins were already very slim. Bulk discounts would work only if the average order value increased.
So, they came up with a hypothesis that offering discounts on certain products could improve the profit margin from their website.
While the control showed no bulk discounts, the variation displayed discounts on bulk purchases of popular products.
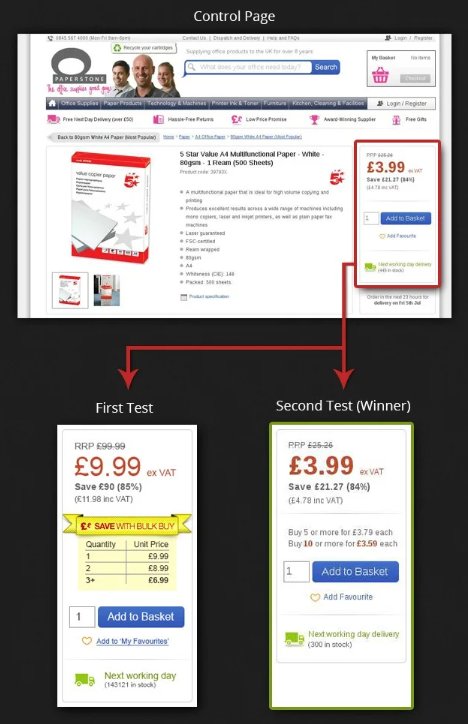
Although it was expected that the bright-yellow bulk-buy ribbon would garner users’ gaze, they completely ignored it. This initial failure made Paperstone rethink its entire bulk discount testing strategy. But they ultimately moved ahead with another iteration where they decided to run the test for a longer time, testing more visitors, for statistically significant results.
Using the same hypothesis, this time the company used VWO to track revenue. Interestingly, the variation outperformed the control, increasing the AOV by 18.94%, the AOV for bulk discount offers by 5%, and revenue by 16.85%.
Download Free: A/B Testing Guide
POSist’s iterative testing strategy led them to discover the best of the best winning variation
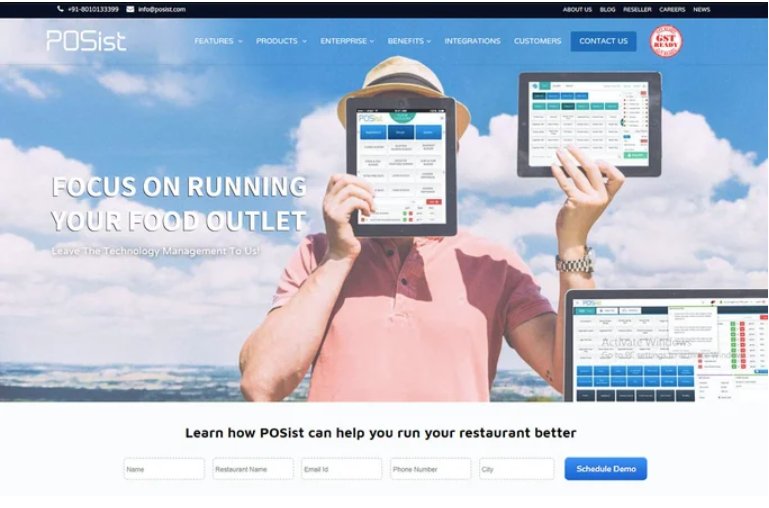
As a SaaS-based restaurant management platform, POSist’s objective was to increase the number of sign-ups for free demos. The team wanted to control drop-offs from the website’s home page and contact page because these two pages played key roles in their website conversion funnel. Given these reasons, POSist turned to VWO and kick-started its optimization journey.
POSist ran 2 home page tests using VWO. In the first test, the team revamped the above-the-fold content on the homepage by including catchy headlines and reducing the scroll length. The variation increased visits to the contact page with a conversion rate of 15.45%, an uplift of 16% from the control’s 13.25%.
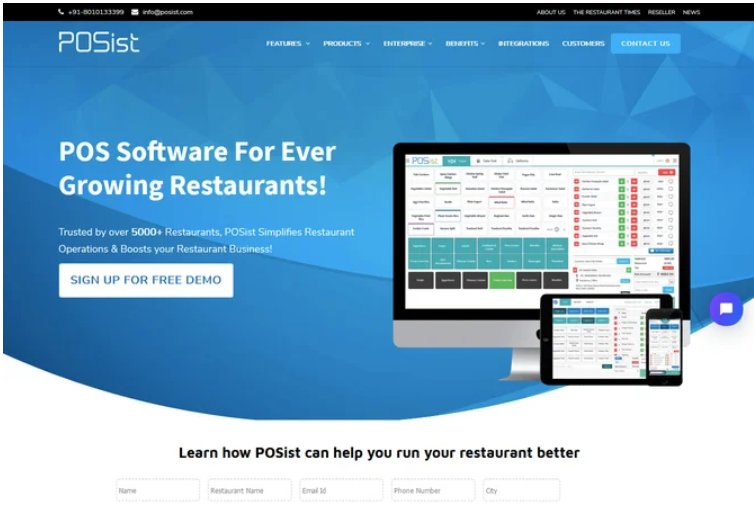
For the second test, they added custom logos, testimonials, and the ‘Why POSist’ section. Plus, they bifurcated their offer – upgrade and make the transition – for prospects switching to a point-of-sale (POS) software application and first-time buyers.
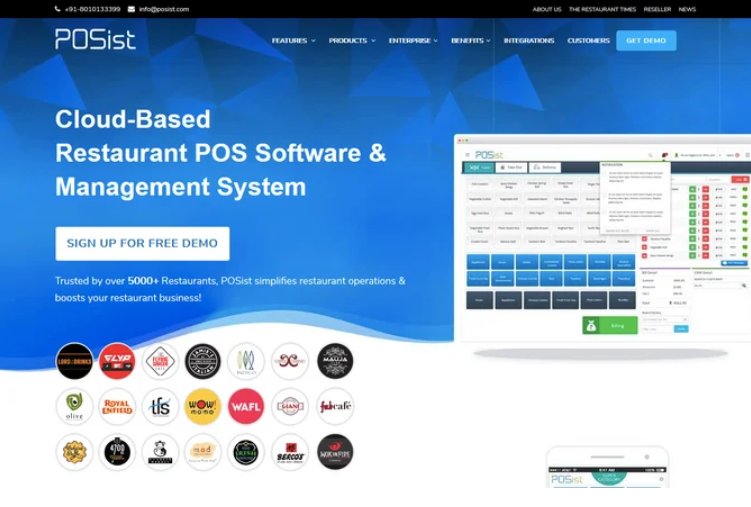
Taking an iterative approach to testing, POSist tested this variation against the winning variation from the previous test. The new variation increased visits to the contact page by 5% in just one week! Consequently, this home page variation was made live on their website.
After sorting their home page, the team studied quantitative data from VWO Form Analytics and inferred that reducing the width of the contact form could improve sign-up conversion. The variation yielded an 11.26% of conversion rate, which is an uplift of 20% from the control’s 9.37%.
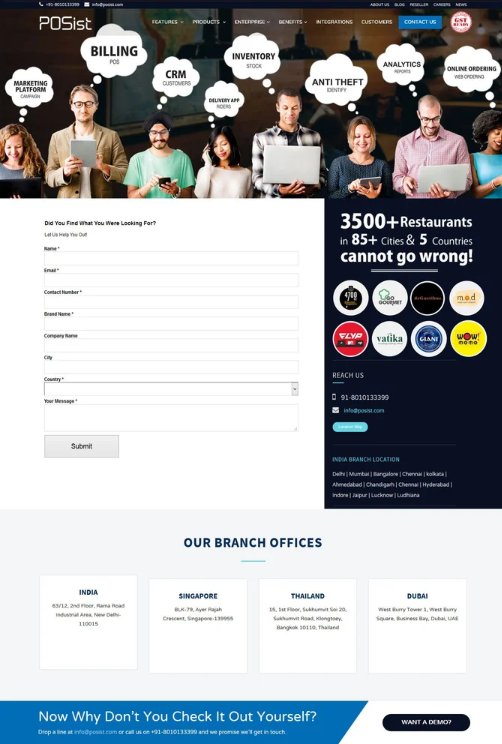
But as they did with the home page, POSist created a more conversion-focused contact page and tested it against Variation 1. This test led to a conversion uplift of 7%, while the two contact page tests improved the conversion rate by 12% combinedly.
This way, the company got 52% more leads in a month! This shows that iterative testing helps you optimize every small gap that contributes to improving user experiences. And it is this commitment to iterative testing that bakes experimentation into the culture of an organization.
Don’t stop but pivot your testing plan
All the ‘never give up’ quotes about successes we’ve grown up reading about should be put to practice in experimentation as much as you do in real life. Provided you wish to focus on big business wins in the long run. Therefore, deriving meaningful insights should be the primary objective behind every test you run, irrespective of the outcome it produces.
But to tread that route with confidence, make sure you have got a reliable CRO tool at your disposal. VWO is hands down the best tool that can help foster experimentation in your organization’s value system with its tremendous capabilities yet ease of use. So, next time you test an idea, look forward to learning and making smarter business decisions. Happy testing!

Now let’s say Netflix is running a country-specific discount campaign. If you are part of this experiment campaign run by Netflix, how do they ensure that you are part of the same campaign every time you log in irrespective of the device and profile you’re using, and see the same promotion everywhere? How do they ensure that your experience with the variation you’re being served is seamless each time and that how you engage with the variation is tracked consistently?
The answer lies in omnichannel experimentation, which is a typical use case of server-side testing.
Should you prefer server-side testing over client-side?
The Netflix example stated above would be extremely complicated to carry out on the client-side and could hamper the user experience. On the server side, it is relatively easy to run and ensures a consistent experience for users. It also ensures minimal impact on page performance. Besides this, it eradicates any privacy-related issues because there is no activity on the browser as such.
There are other use-cases where server-side testing is recommended for its robustness and flexibility. We will talk about these in this article. But first, what exactly is server-side testing, and more importantly, who is it for?
In server-side testing, the test variations are processed on the web server. When a visitor lands on a page being tested, a variation is fetched directly from the server and delivered to the visitor’s browser. No subsequent modifications then take place on the front end or the browser. Contrary to this, in client-side testing, the original page loads first in the visitor’s browser and your experimentation platform creates the variation on the front-end itself using JavaScript. Let’s understand the scope of these two forms of testing with an example.
Imagine Mike and Bob are two friends who are trying to experiment with the workings of a new car. Mike is at the wheel and has access to brakes, accelerator, dashboard, and the like. Bob has a view of the internal components like the engine, radiator, battery, etc. Both can influence the car in different ways. What Bob does with his access to the car components can reflect on the outside to Mike. The changes that Mike tests are based on his visibility of the car. From the car buyer’s perspective, the outcome of experiments run by both Bob and Mike can serve equally important, but different purposes.
Therefore, you don’t have to choose one form of testing over the other. The use-cases are different and the teams using the tools are different. Server-side testing is an experimentation avenue for developers and product managers, just like client-side testing is used more often by marketers.
Which problems can be addressed with server-side testing?
Server-side tests run by product teams solve problems concerning a myriad of industries from eCommerce and SaaS to banking and media. Some important use-cases where server-side testing is recommended over client-side testing in different industries are described below:
Product recommendation
Which set of recommended products entices your visitors to purchase more? Server-side testing allows you to test multiple product recommendation algorithms to determine the selection that leads to an increase in sales and revenue. For instance, you can test whether a layout that promotes similar products works better than a layout that promotes the most popular ones. You can also decide whether to upsell or cross-sell based on your server-side experiment findings.
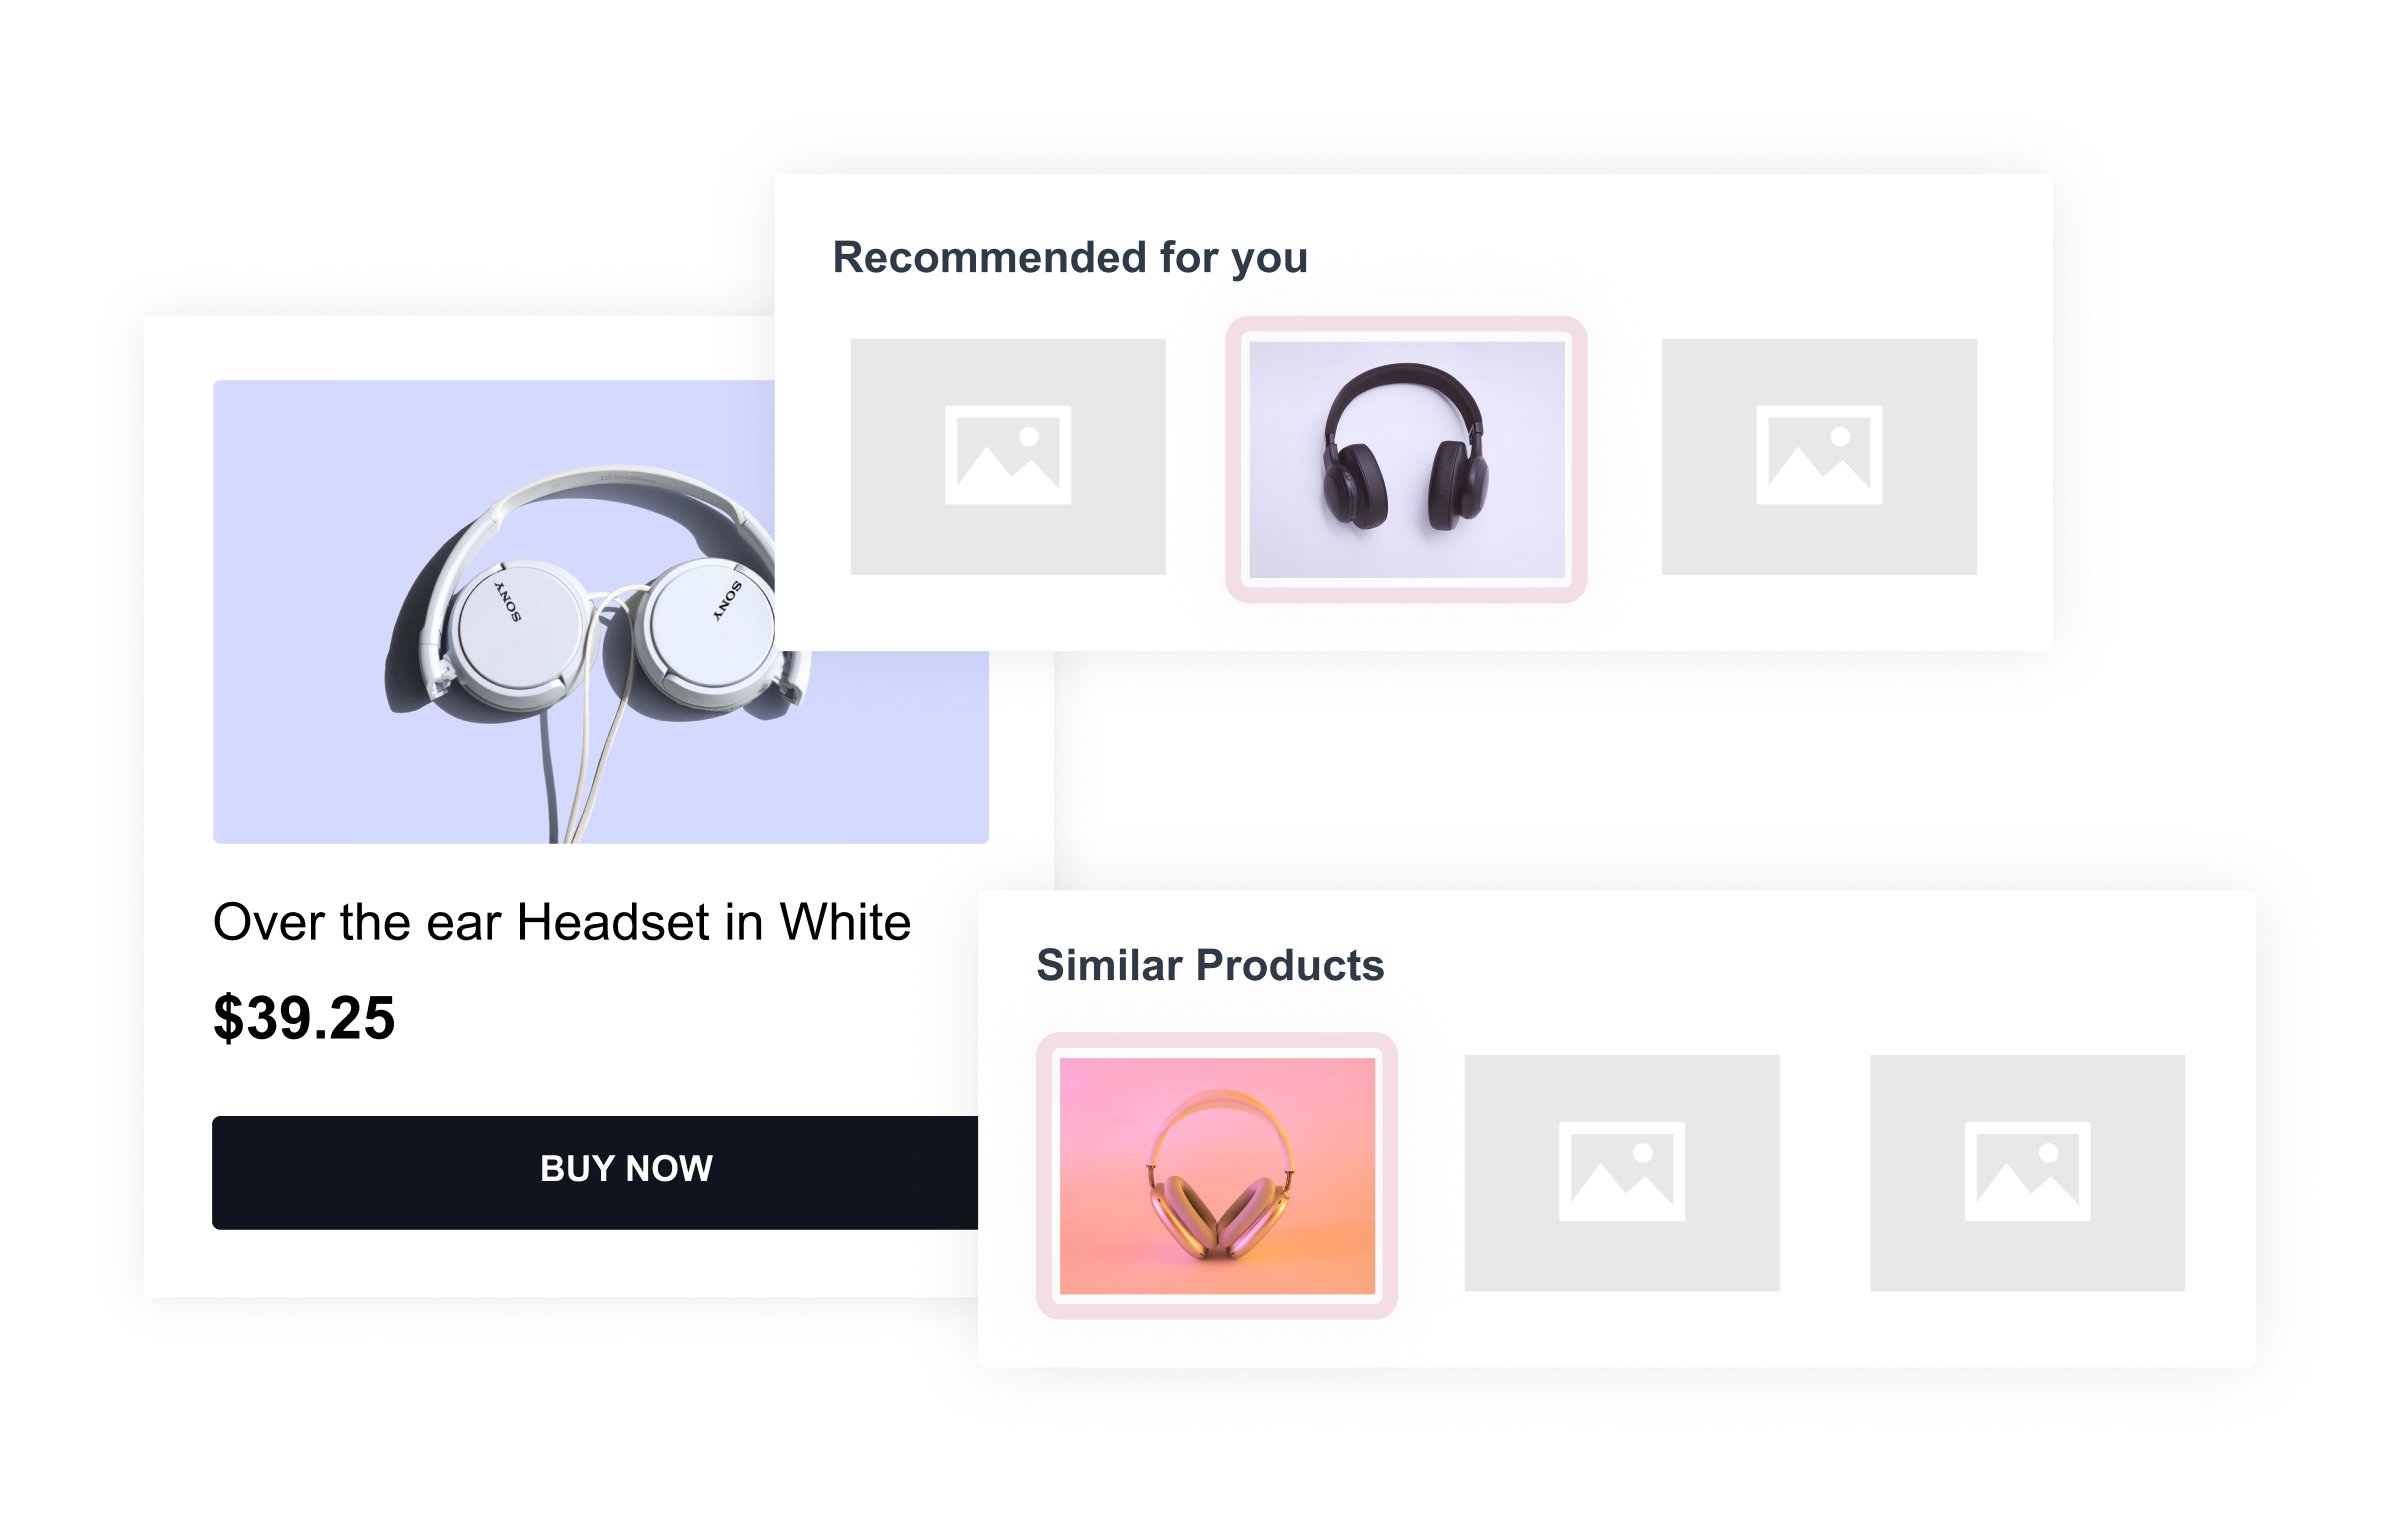
Shipping fee
What is the ideal cart value that should qualify orders for free shipping? You can test out various thresholds to determine the one that positively influences customers’ purchase decisions.
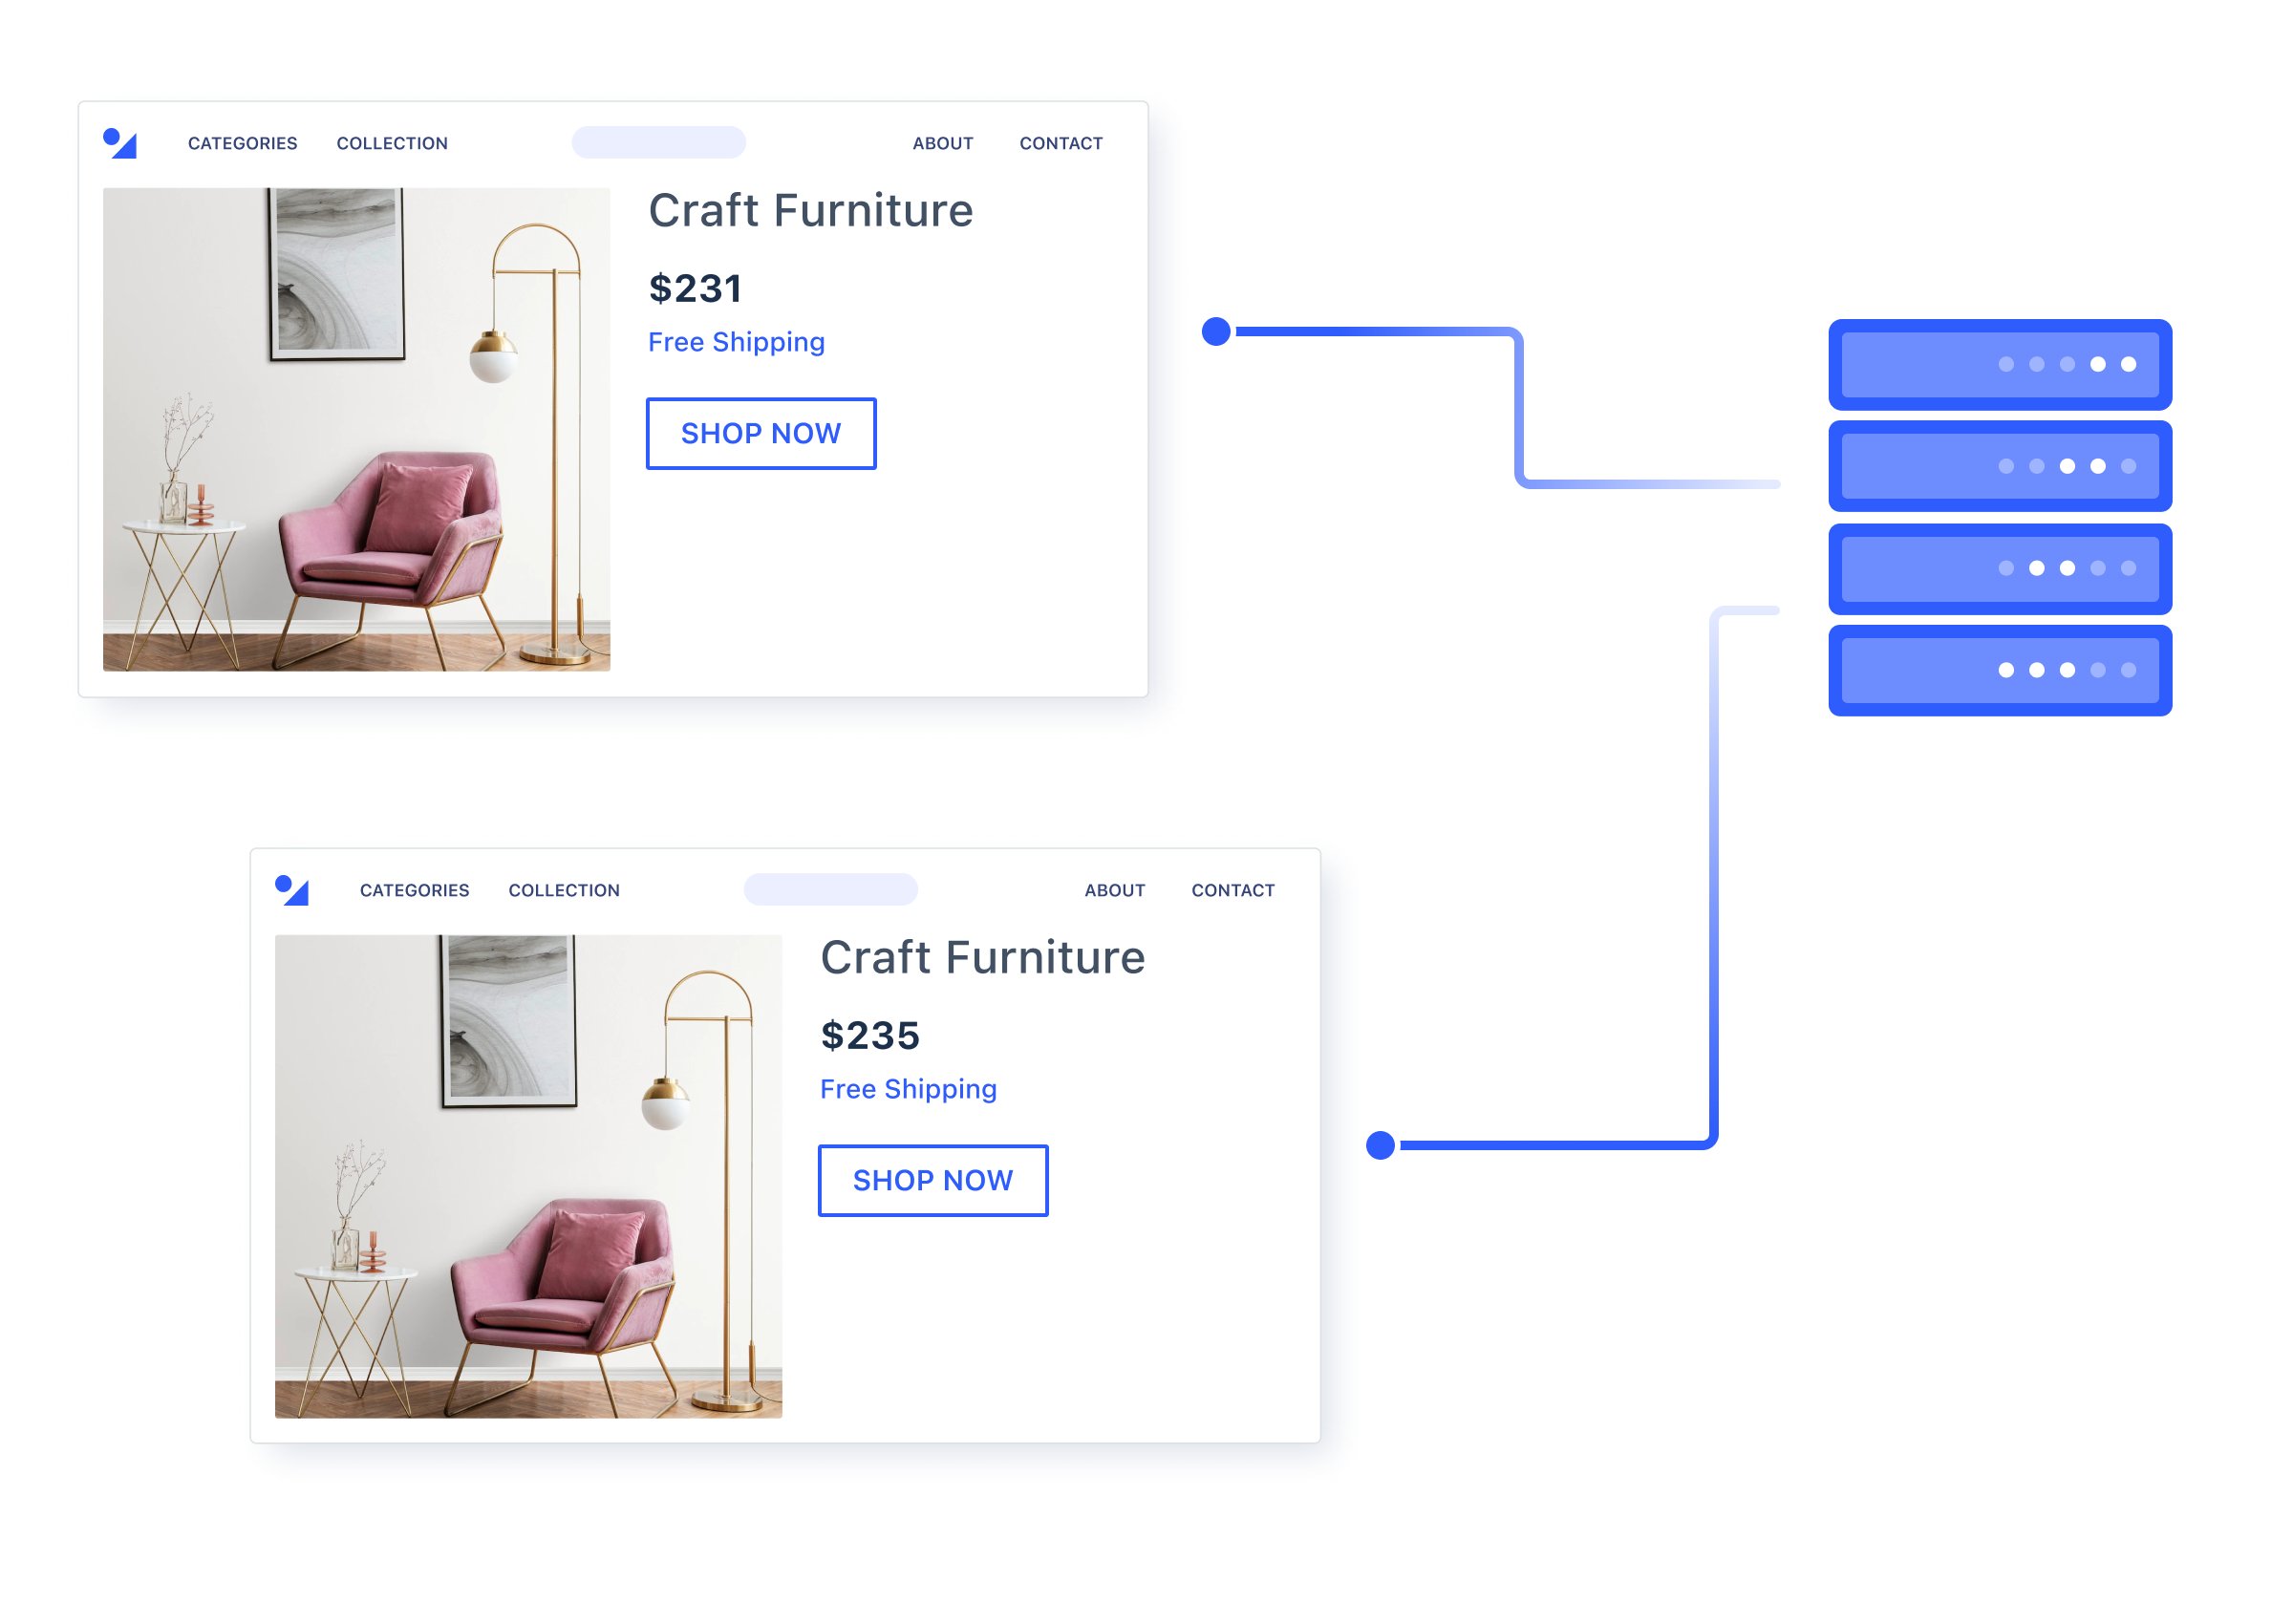
Search algorithms
Experimenting with your search algorithm requires modification to your existing code and the flexibility to test deep. You want your visitors to be able to quickly find what they are looking for and you can test your search algorithm on the server-side to achieve this.
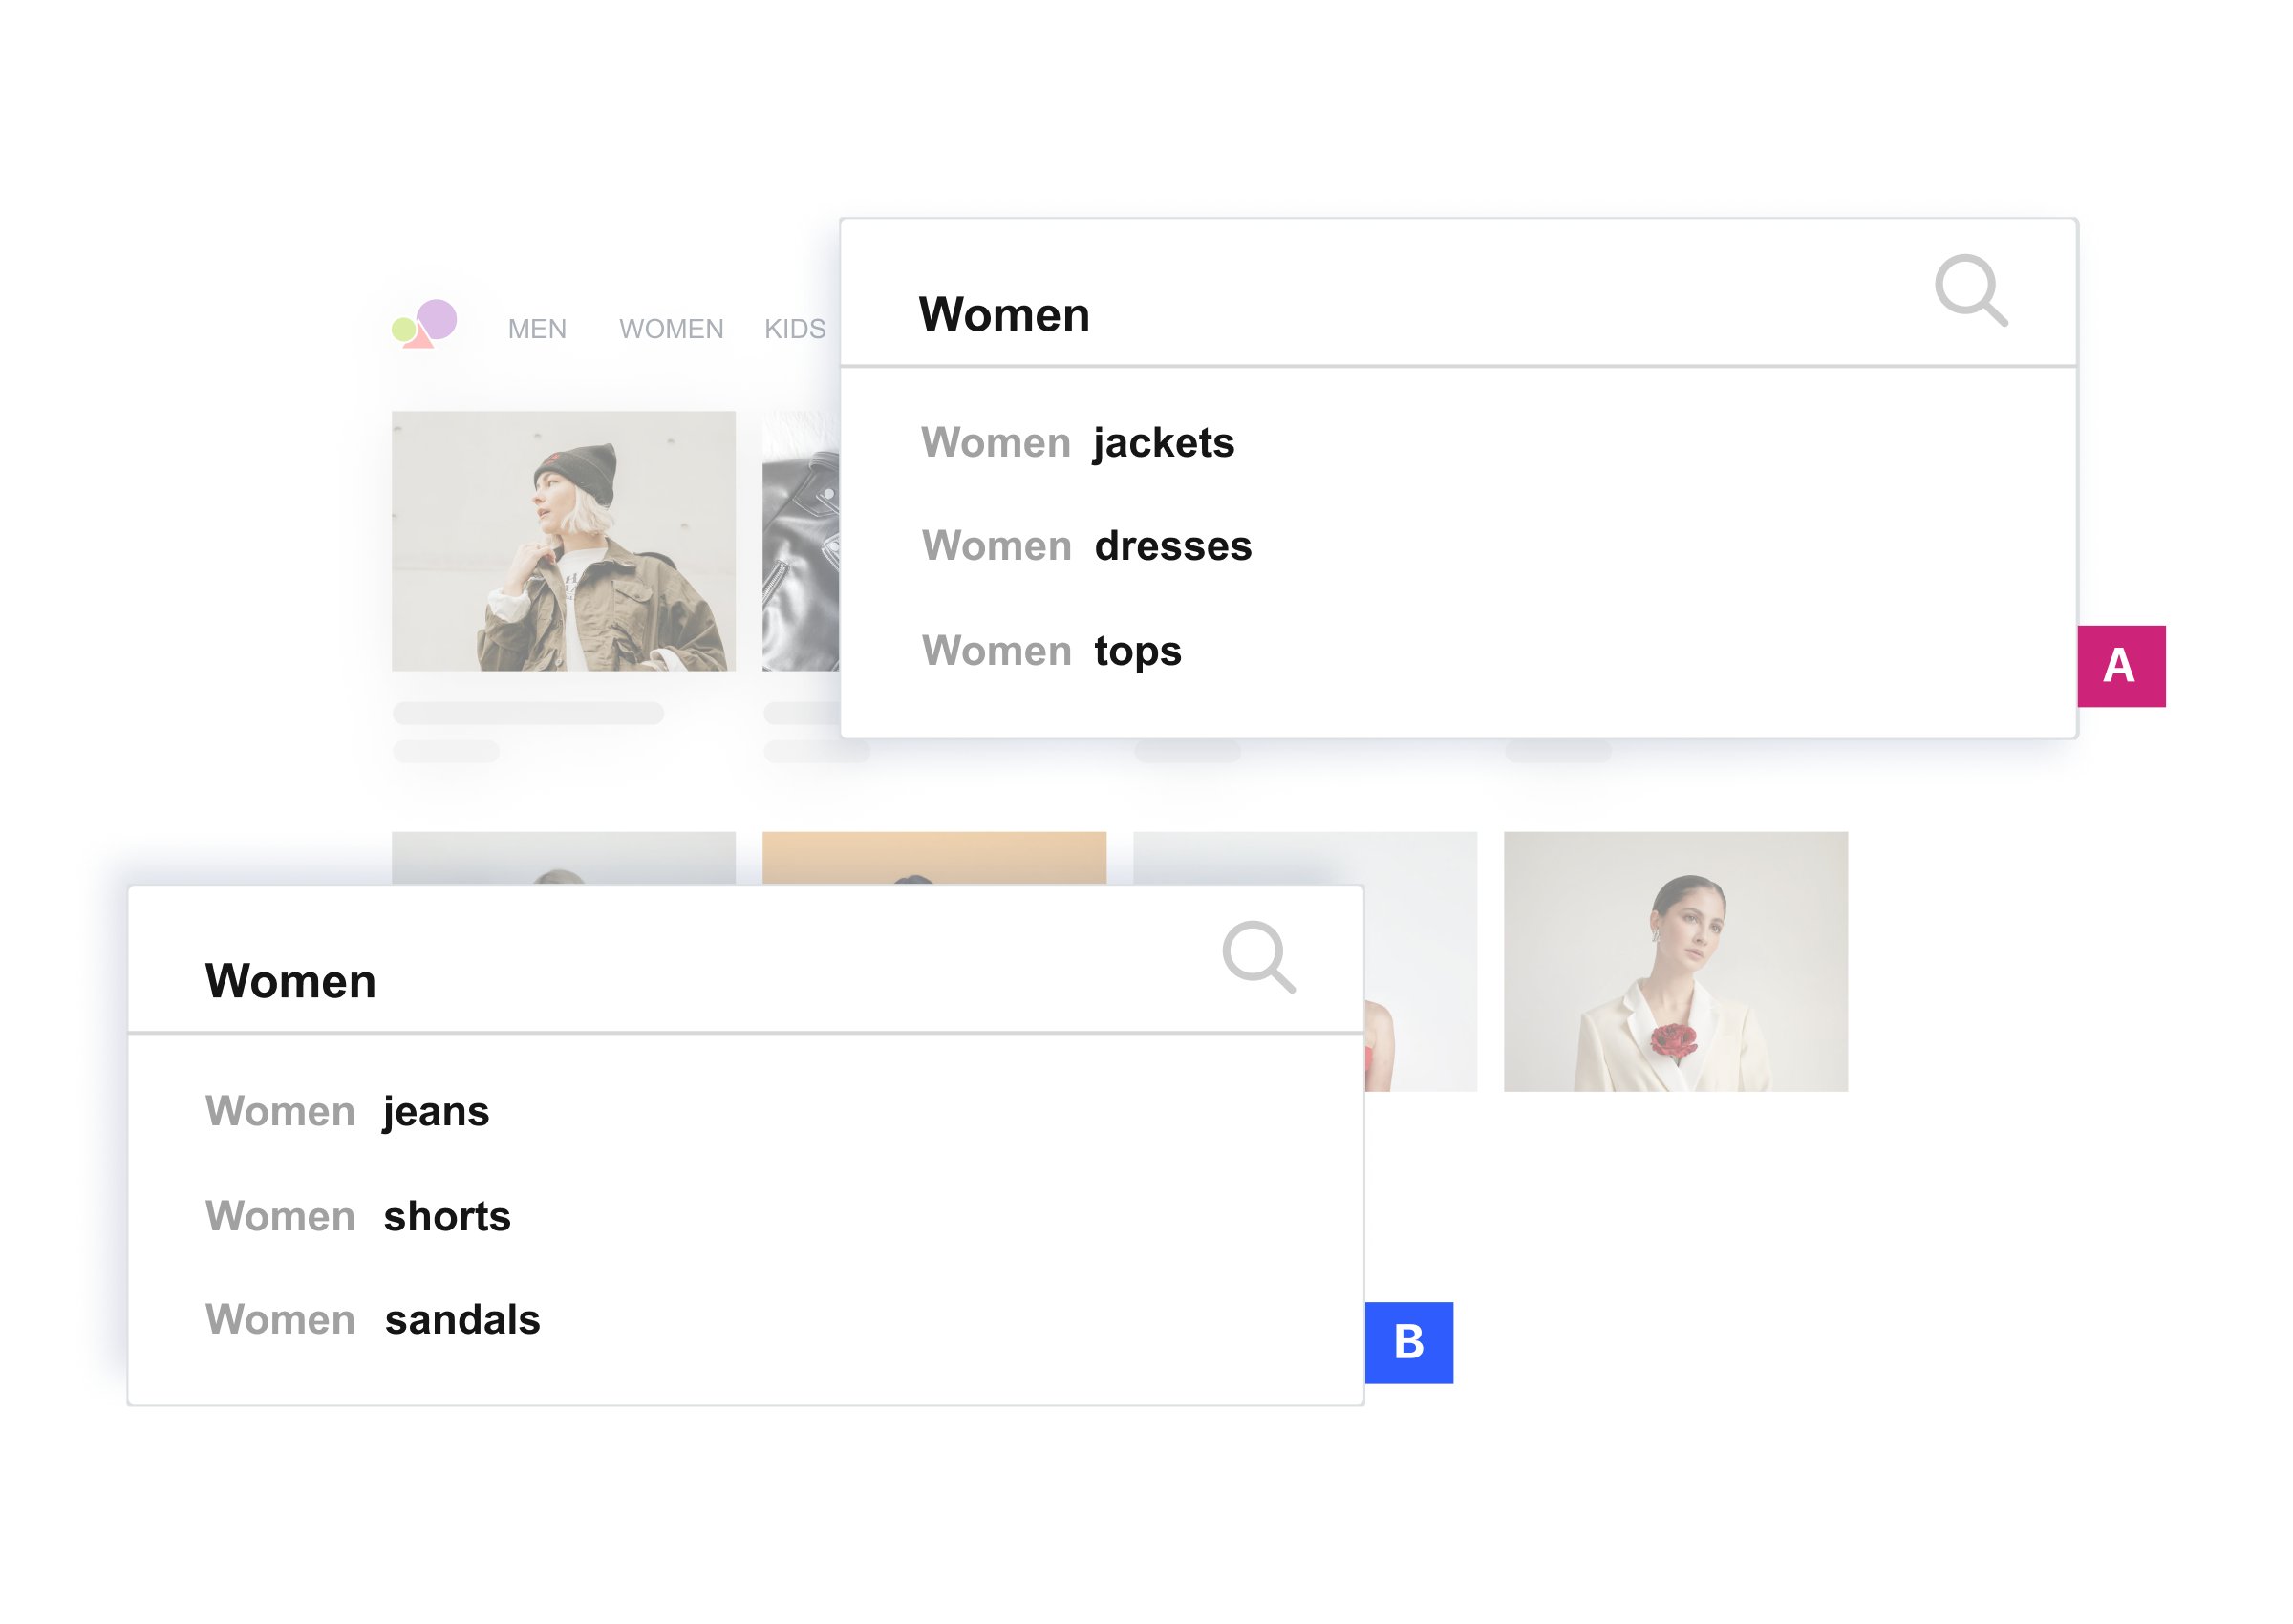
Form length
Free trial and demo request forms are crucial to SaaS businesses. But what is the ideal form length that ensures lesser drop-offs while also capturing all the required information? You can test out the non-mandatory fields via client-side testing. If your field is obligatory, just hiding the field using JavaScript will not work as form validation using server-side logic will fail. Hence server-side testing is recommended to experiment with mandatory fields to optimize your form length and complexity.
Deals and discounts
While the style, look and feel, and placement of deals on your home page can be tested easily on the client-side, there are other important factors like the value of the discount, its duration, or eligibility criteria to consider. You can test on the server-side to determine the optimal value and ensure that they are consistent across channels for a particular visitor.
Sales incentives
Testing dynamic incentives like limited-period offers or stock clearances require the flexibility of server-side testing because of the granularity involved.
Subscription flows
How many steps should ideally be involved in a subscription process? Should social logins be provided? Experimenting with the subscription flow can help answer these questions.
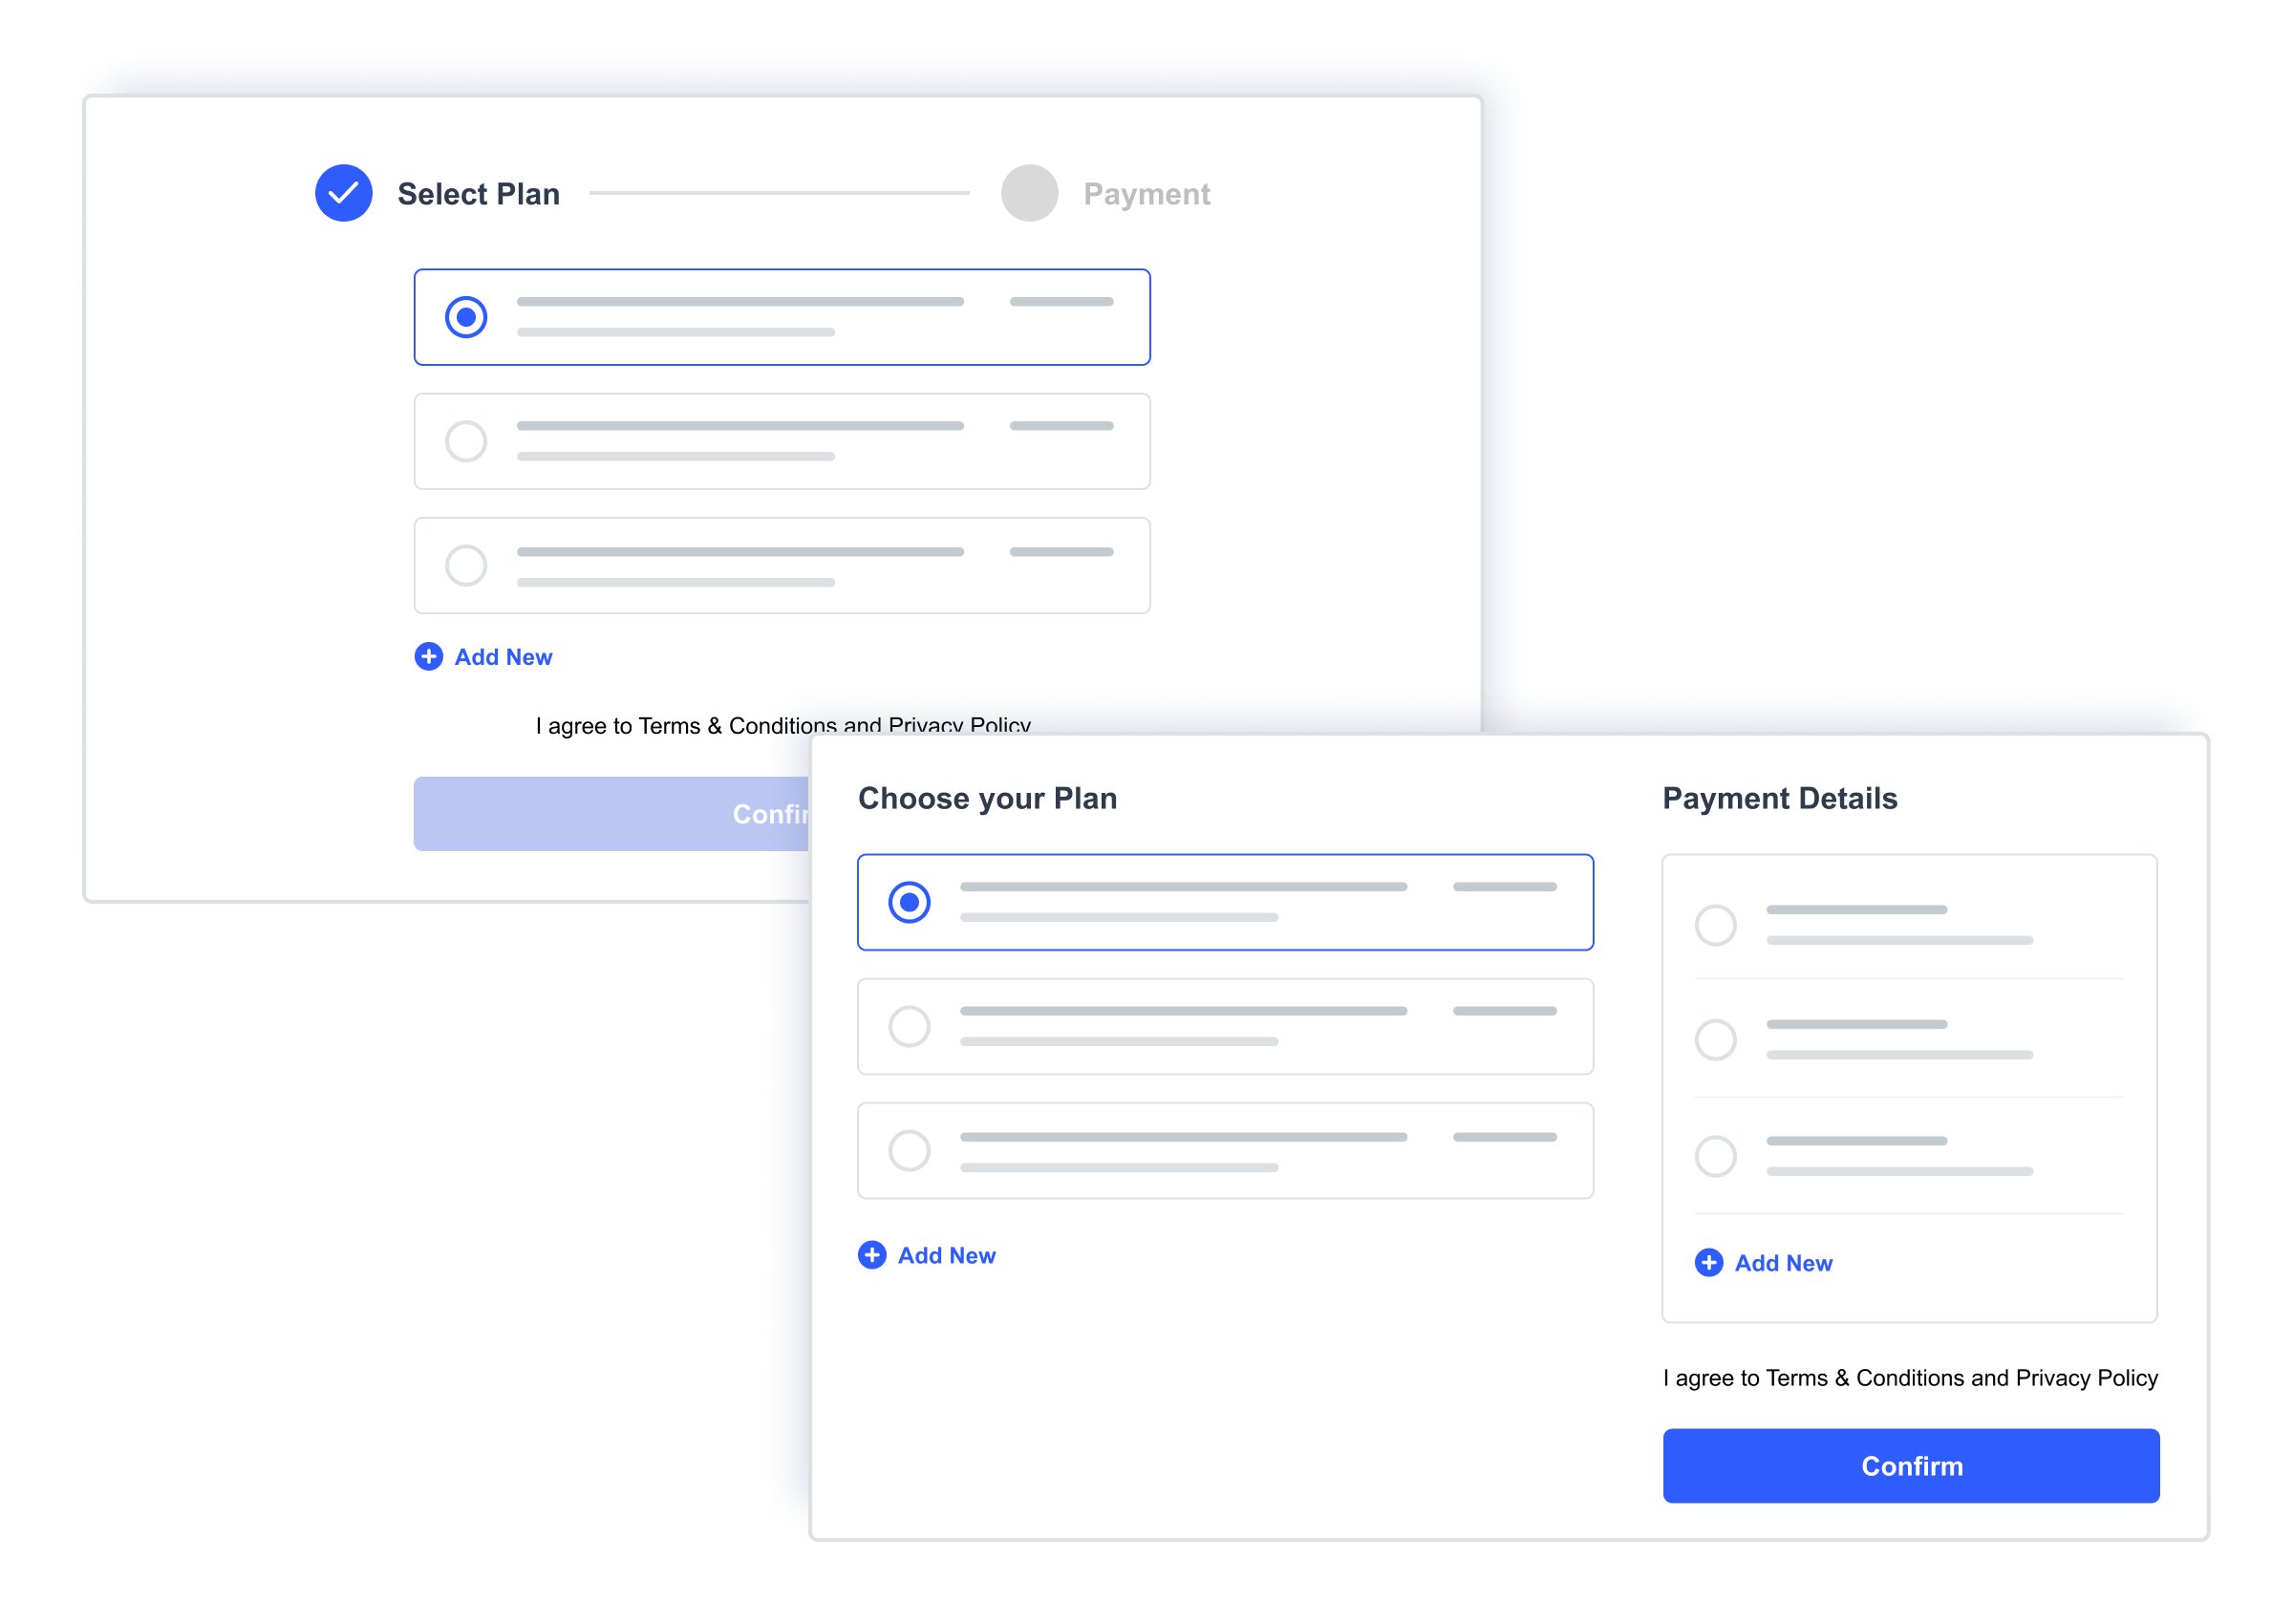
Paywalls
Server-side testing allows you to test various paywall configurations in a fool-proof manner. As a publisher, you can run server-side tests to experiment with your gated content and monetize it. Running the same test on the client side is not recommended, because visitors can make their way around a paywall by deleting or opting out of cookies.
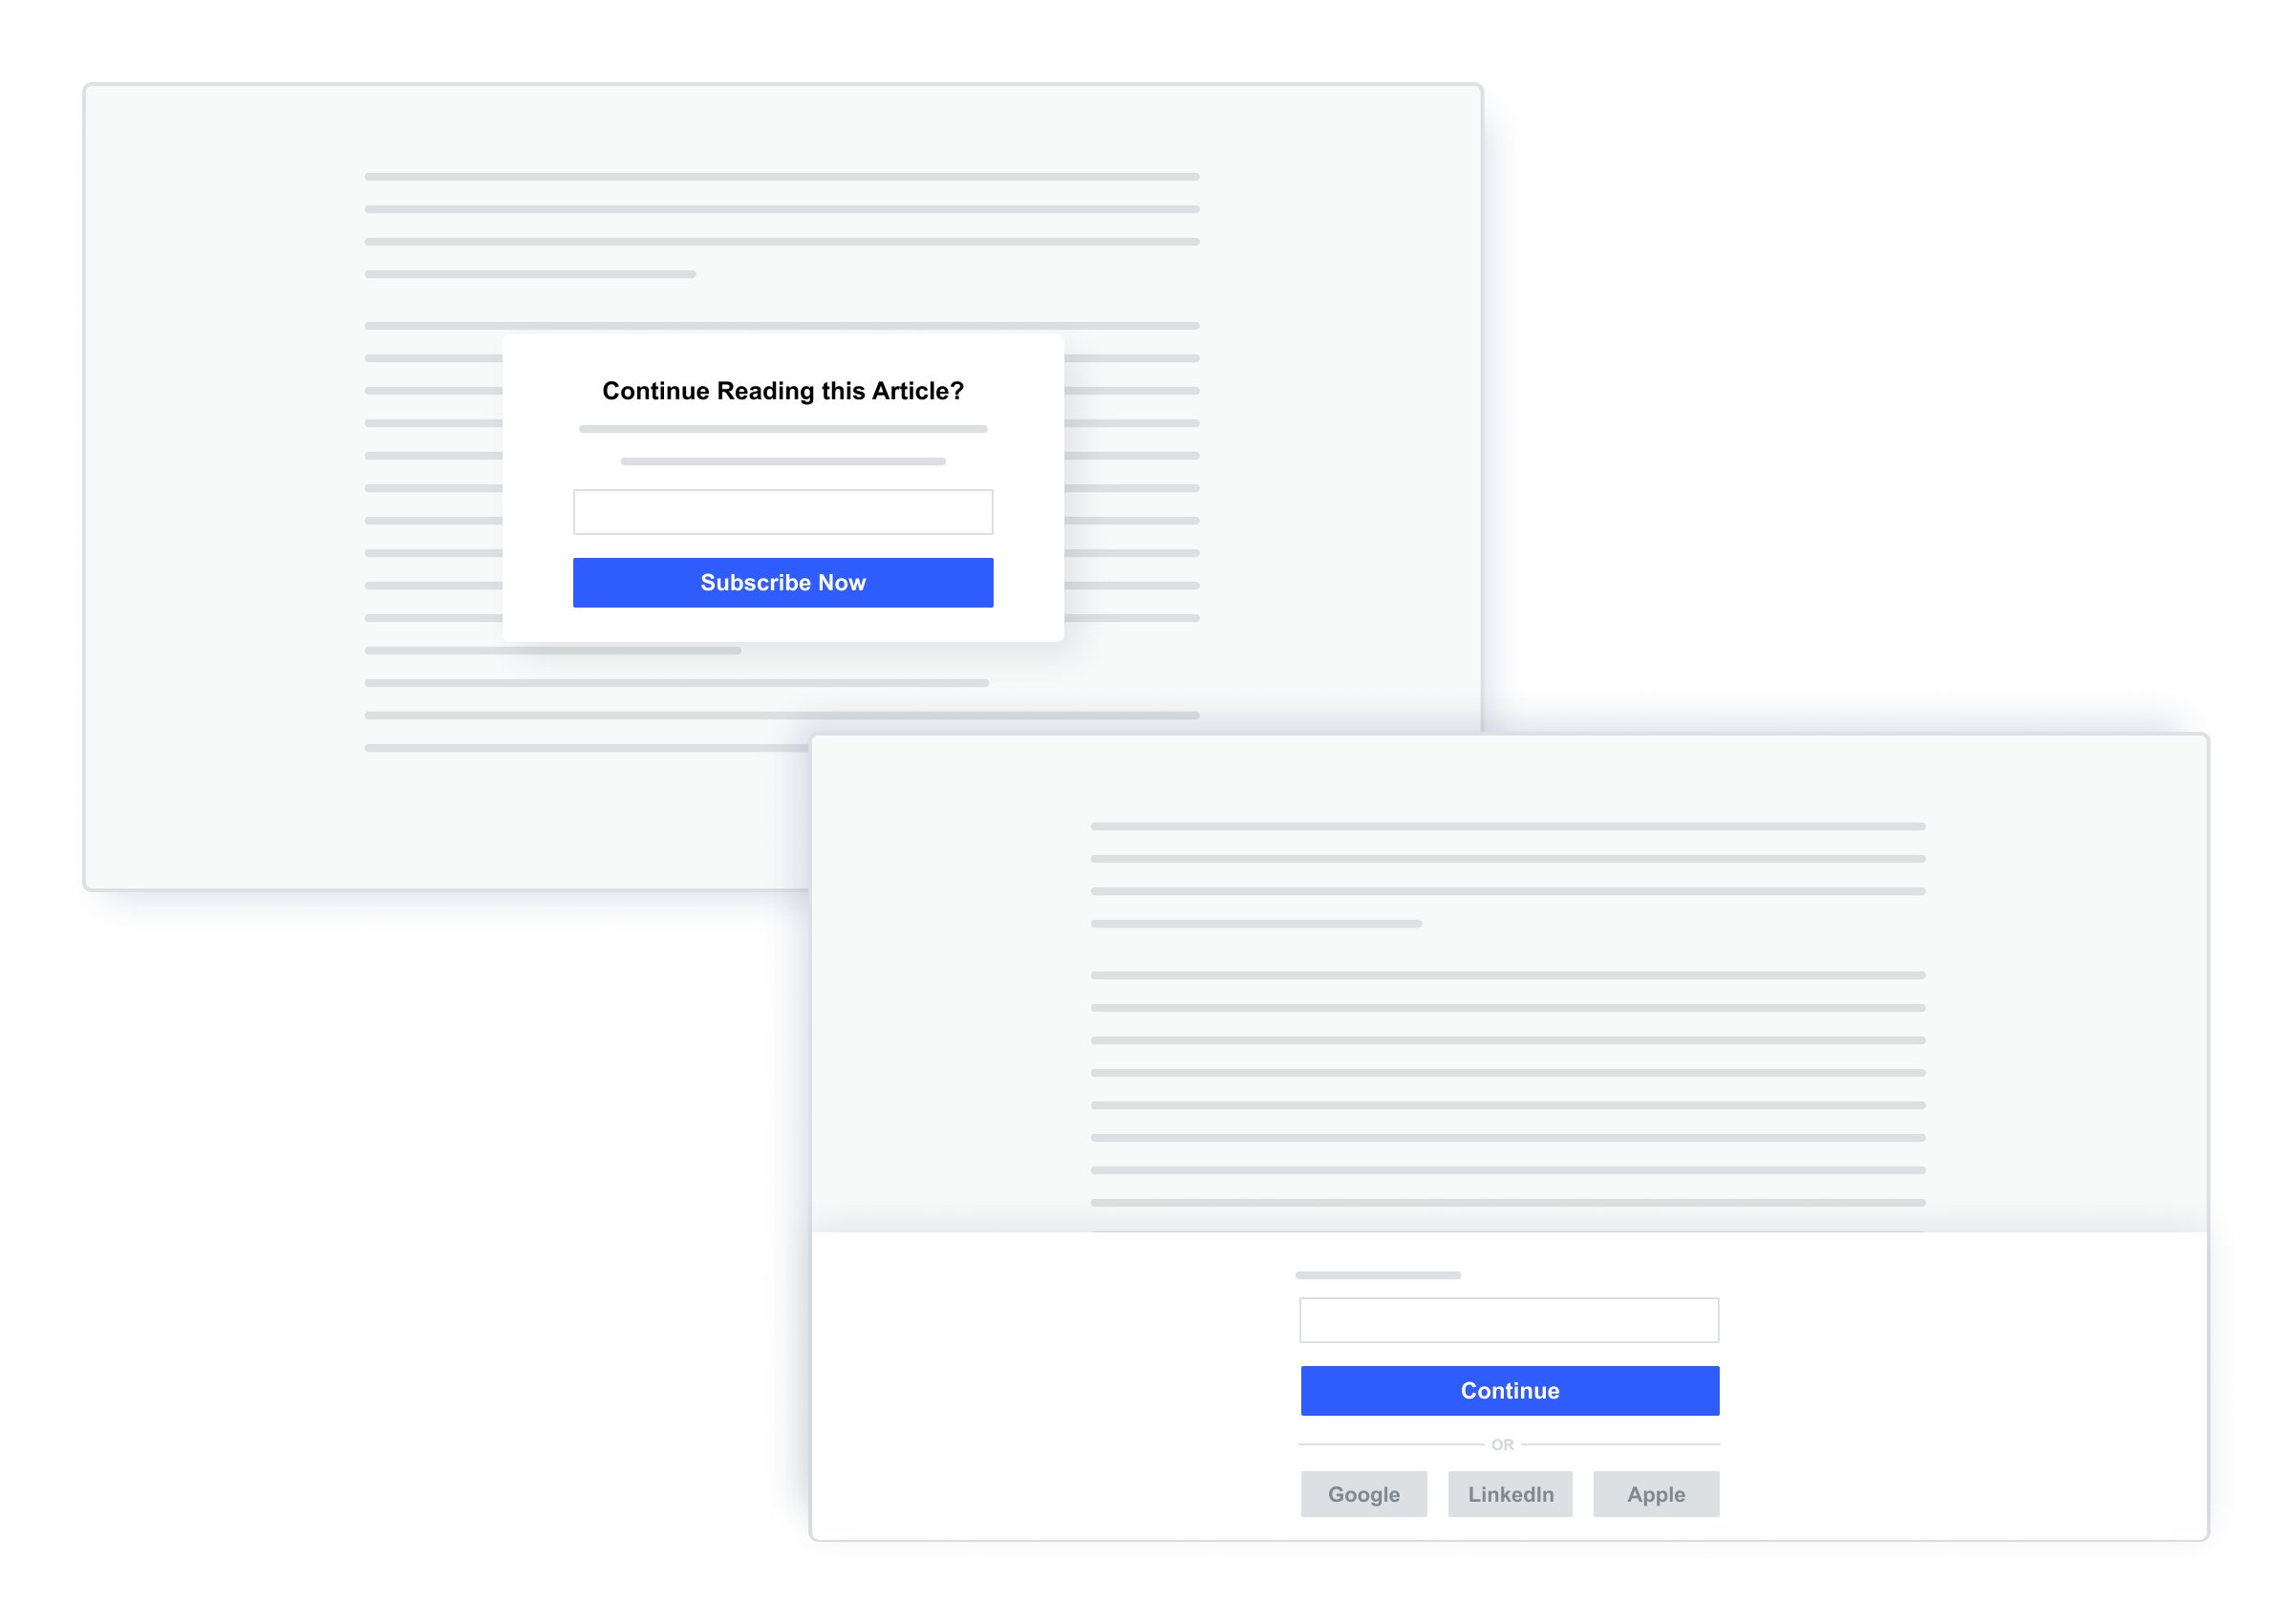
Mobile banking
Multiple elements can be optimized within the sign-up process for a loan or a credit card. But when it comes to mobile banking, data security becomes paramount. With client-side testing, sensitive data collected by banks or financial institutions could be at a vulnerability risk. To avoid this risk, server-side experiments are usually recommended for banking applications.
Let us now understand how you can run Feature tests on the server side and the advantages of doing so with VWO.
How VWO makes server-side tests easier
For the server-side use-cases described above, VWO gives you the flexibility to structure your campaign either as A/B tests or Feature tests. Feature tests are used to validate values of feature parameters and give you the control to quickly configure a feature, without writing code. In some use-cases like testing which search algorithm is better, it is possible to structure the campaign both as an A/B test or Feature test.
For instance, say you want to evaluate three vendors for the search algorithm they have built for your website.
Feature testing enables a product manager like you to quickly test and conclude with minimum dependency on engineering and maximum control of the configuration. With VWO’s Feature testing capabilities, you get a set framework where you need to write less code because the platform does most of the heavy lifting for you. In Feature testing, the algorithm can be defined as a feature variable and be configured in control and variation of an experiment from the platform setup flow itself to test which search algorithm is more efficient.
This experiment can be done via server-side A/B testing also. VWO facilitates the traffic distribution and experimentation statistics model capability via its server-side SDKs. Engineering teams can use the same to insert the code of the search algorithms and test which is more impactful.
Here are some other scenarios where Feature testing comes in handy. Say that a third-party vendor handling mobile recharges wants to charge a nominal amount to users per recharge. They want to test the appropriate amount for the same. Or a company like Airbnb, where the property charges are handled by the owner, wants to add in a cleaning fee and see if that impacts the number of bookings. This is a typical experimentation use-case for various companies to find the sweet spot where a service charge can be inserted without impacting the north star metric. It could be in the form of a convenience fee, facility fee, covid fee, packaging fee, or something similar.
Complex use-cases like the one described above are super easy to test in VWO. Here’s an explainer video that shows you how you can quickly create a convenience fee feature and assign a value to it (in this case the amount of the fee). You can link your hypothesis of identifying the fee that adds to revenue without impacting the number of bookings, choose the environment you’re running the test on, and enable your variations. Once you do that, you’re provided with a campaign code that goes on your server. All that remains is for you to define the goals you want to track and segment your audiences if you wish to – that’s it, your campaign is ready.
If you are a product manager and you see on the dashboard that variation 3 is not working for the users; it is negatively impacting revenue, you can kill it right there by simply disabling the variation in VWO. As shown in the screenshot below, this does not impact the code and doesn’t require your engineering team to make any changes. You need to turn it off, click ‘save’, and the variation stops receiving traffic.
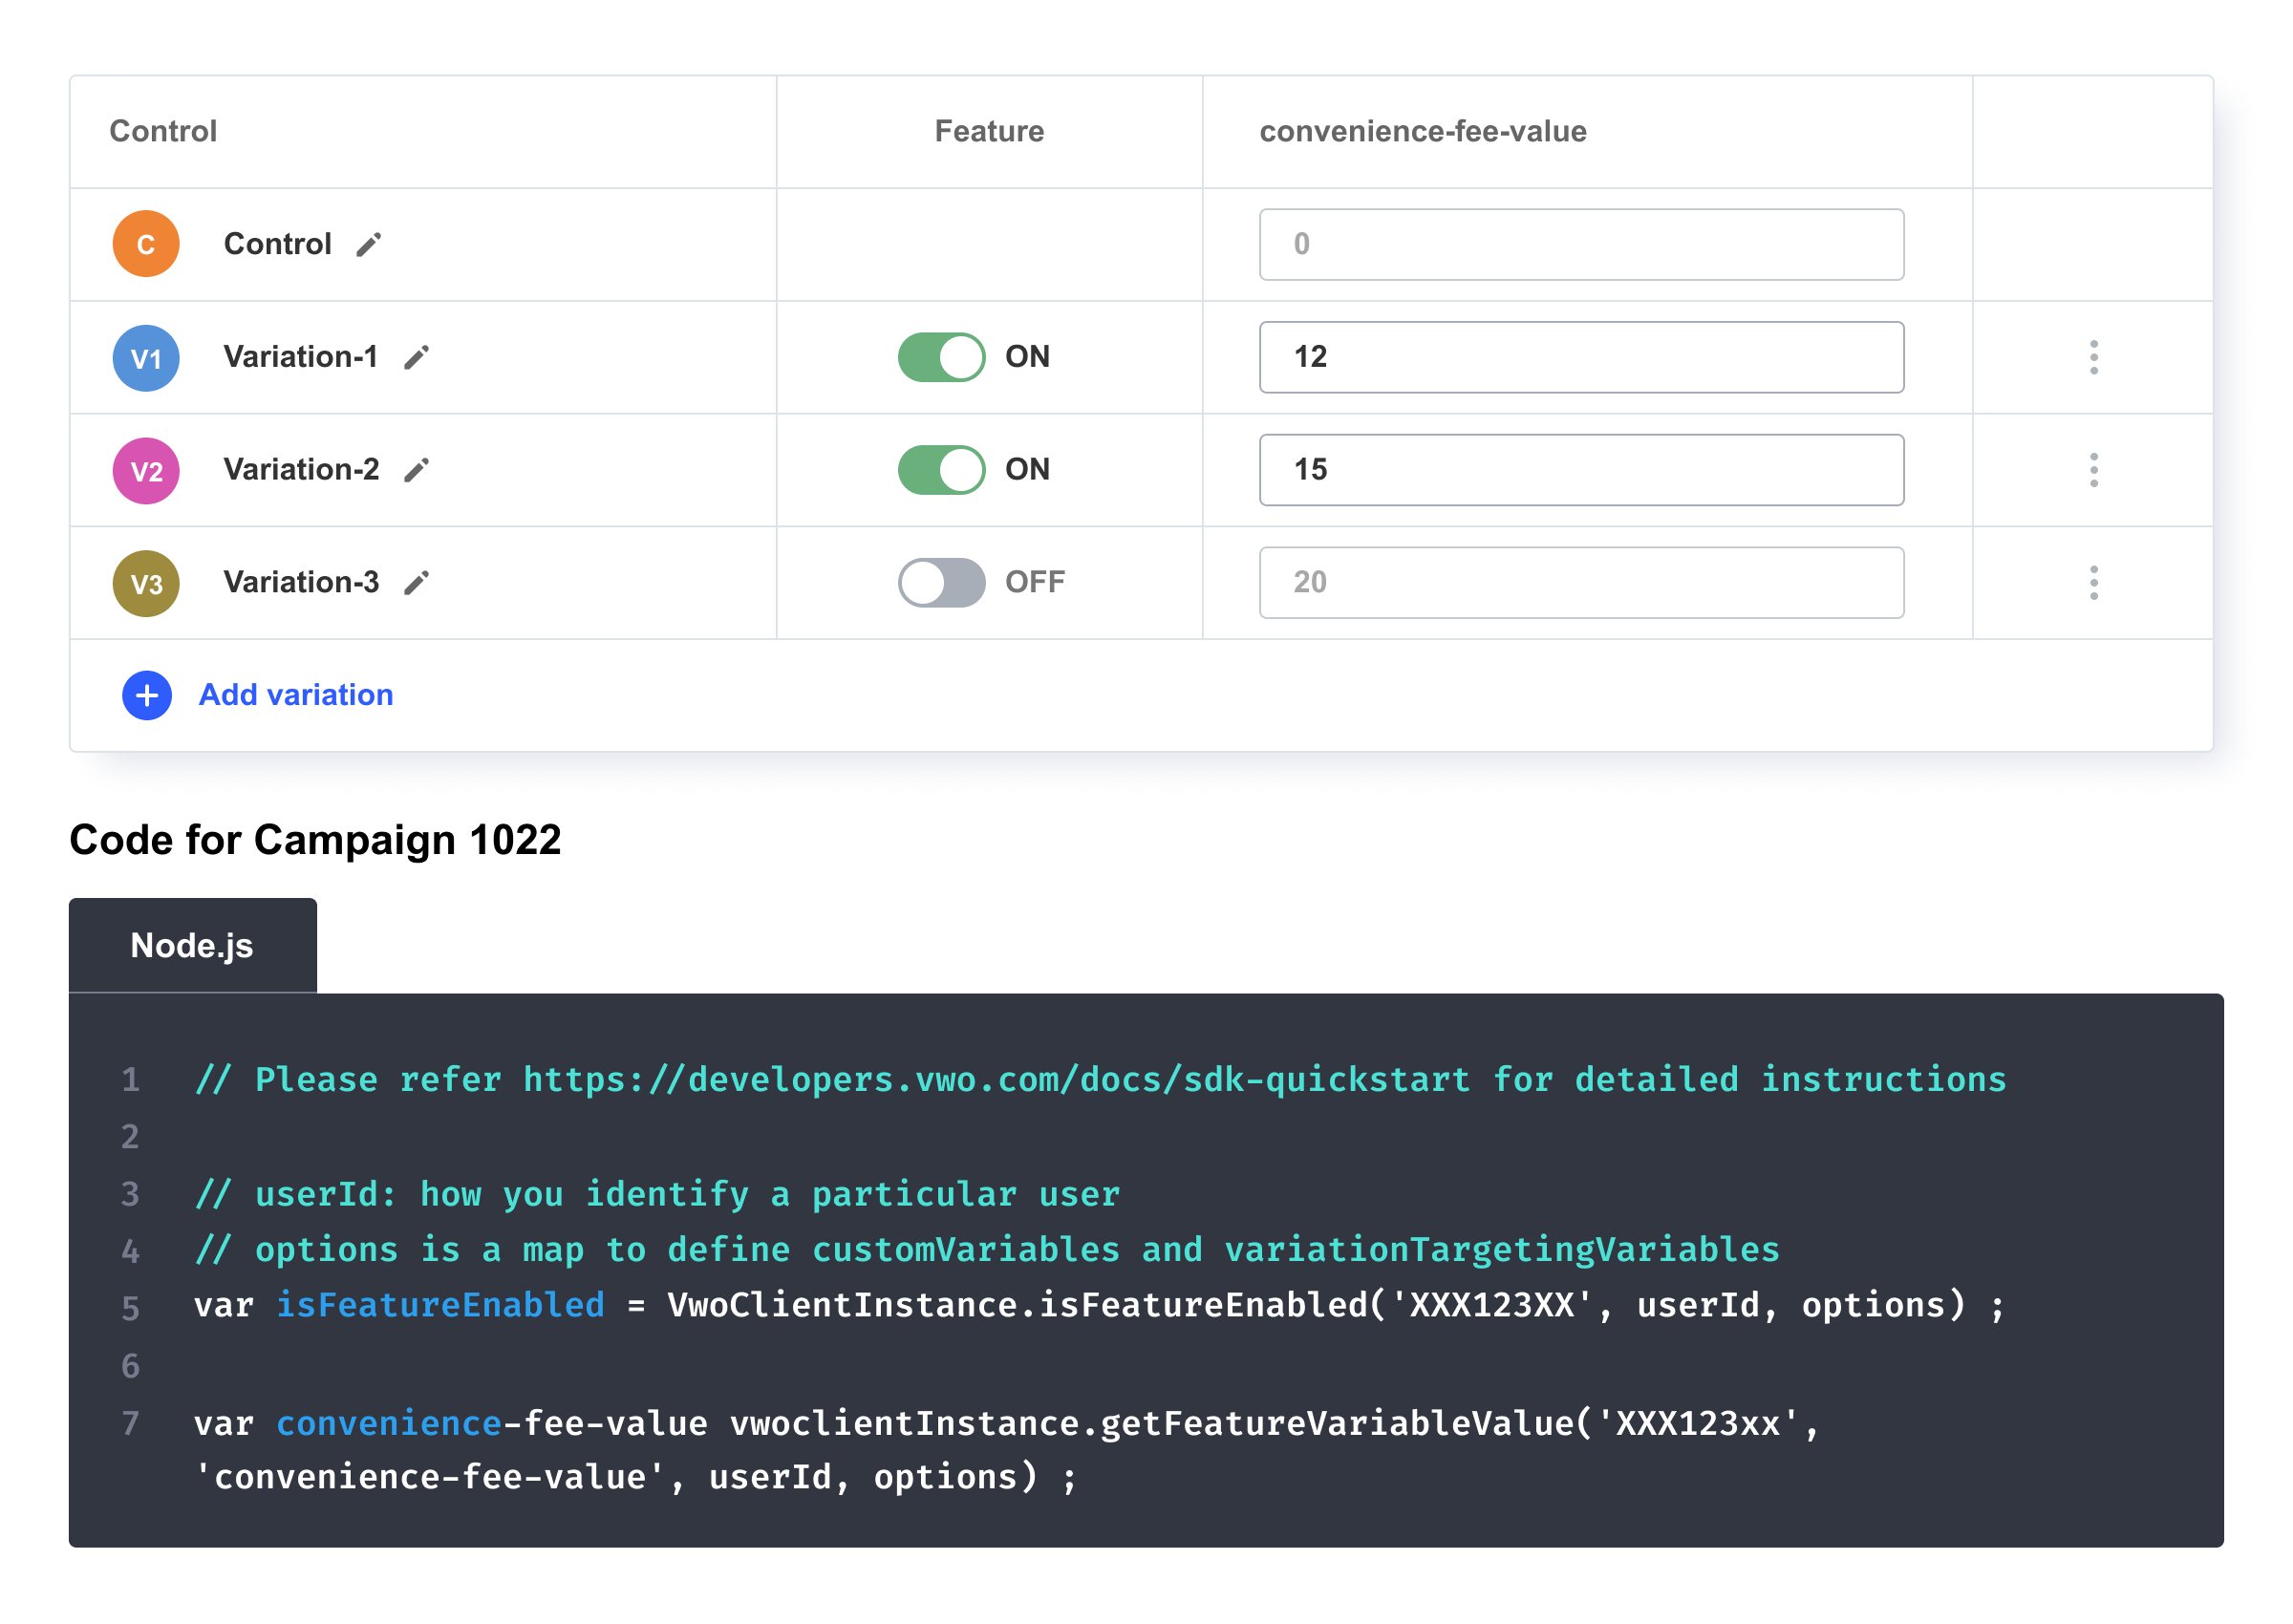
Screenshot of a Feature test campaign in VWO
Essentially, the code needs to be implemented only once per campaign.
Should you build or buy a platform to run server-side tests?
Let’s put an end to the build vs. buy debate. VWO is not just a random number generator that shows different variations to different audiences and captures conversion events. VWO is a complete experimentation platform with a robust statistical model. To weigh in on whether to build a server-side testing mechanism in-house or invest in a platform like VWO, you need to consider three primary factors:
- Cost of ownership
Even when companies manage to build the required infrastructure in-house, they still need to manage and scale it. Paying your development teams to build and maintain an experimentation engine like VWO instead of focusing on their core jobs is likely to end up being more time-consuming and costly for you than investing in VWO.
- Ease of use
You could build a solution that shows a certain variation to a certain audience – but would you have an easy-to-use interface that can be controlled not only by the engineering teams but also by product managers? If not, that’s another blocker for you to run server-side tests.
- Intuitive reporting
Typically an in-house solution would give you basic things like the number of visitors and the conversions that are coming from a particular variation. But what you need is a statistically significant result. You need your reports to be powered by a Bayesian statistics engine like VWO SmartStats. That’s where the gap lies – you can build a basic solution that’s hard to maintain and you can spend time and resources on deciphering the p-values. Or you can choose a solution like VWO where there’s a team dedicated to maintaining and scaling it and has spent years on the Bayesian algorithm to give you easily interpretable results. The in-app dashboard in VWO enables even your non-technical team members to understand results; they don’t need to rely on the Analytics team to keep track of experiments or create result dashboards – thus saving time and reducing the cost of experimentation.
- Error-free mechanism
Building a server-side testing solution in-house can be prone to errors, and on that scale, the errors might not be easily discoverable. Compare that to the quality of a platform that is used by global brands and you’re ensured that the chances of errors creeping in are minuscule. Any errors, if at all, are flagged and rectified at the earliest by a capable support team available to you.
Besides, when you invest in a managed platform like VWO, important best practices are built into the product. You don’t have to worry about removing the outliers from your results, visualizing your data, or about issues arising due to version updates.
Must-have capabilities to run complex server-side tests with integrity
Running server-side experiments can be very fruitful when executed correctly. To do so, you need to have the right set of feature capabilities. Some of these are laid out below:
- Randomization of visitors in each test – In testing, when you’re bucketing your audience into campaigns, the randomization of visitors needs to be truly random and not pseudo-random.
- Consistent omnichannel experience – While the bucketing of users needs to be random, you also need to ensure that one user experiences the same variation each time they log in, irrespective of the device they are using. The experiment should carry forward without any glitches.
- Mutually exclusive campaigns – Let’s say you have three factors to consider while determining whether a user should be part of your test. These could be usage regularity, low likelihood of churn, and timezone. Apart from taking into consideration these variables, you also need to determine exclusivity – so how many tests can the user fulfilling these conditions be a part of? This needs to be determined in a way that doesn’t lead to skewed data and enables you to attribute the improvement in conversion rate to the right campaign without bias.
- Standardized naming convention – Whether you’re setting up a new feature to test or a feature flag, you need to follow a standard naming convention to avoid mix-ups and cases of initializing the wrong features or tests.
- Unique and hassle-free campaign identifiers – You should use an alphanumeric key to uniquely identify the test in your code and avoid any hassles at a later stage.
- Choosing the right environment – You should specify the environment in which you’re running your test – for instance, you can deploy the test in the staging or QA environment for your QA team to validate the experiment. A sanity check of your test is crucial to its success and you should have the option to choose the right environment for it.
- Logical traffic allocation – When you’re running multiple campaigns or when you have an important event announcement like a Black Week Sale, for instance, you need not include the entire set of visitors landing on your page in your test. You should choose the percentage of traffic that you want to include in your test campaign and also how you want to distribute this traffic among the variations.
- Calculation of the time to reach statistical significance – Your estimated time for your test to reach statistical significance should be determined by the present conversion rate of your primary goal and the minimum improvement that you wish to achieve through your variations. It should also consider a 95% probability to beat the baseline conversion rate.
These are some of the best practices and must-have features of server-side testing – the actual list is much longer. As mentioned earlier, you could either build these capabilities in-house, or you could use VWO where we do the job for you.
In conclusion
Whether you’re a developer or a product manager, you don’t need to limit your test ideas. You can run complex tests without fearing performance or privacy issues with server-side testing and solve real issues faced by your customers. You can optimize every digital touchpoint so that your customers experience only the best.
If you’re using a platform like VWO, the complexity of the test will not overwhelm you – because every input of yours in the campaign is intuitive and a good practice that powers your test. To understand more about how you can run server-side tests with ease using VWO, request a demo with our product experts.
]]>Have you also spent hundreds of hours gathering and analyzing website data to build experiences that show no change in conversions?
If this is your story, I’ve got two good news for you.
First, you’ve arrived at the right place. And second, you’re not alone!
The case of missing uplift in conversion and revenue
Take the case of an online phone accessories retailer who recently launched a new line of customizable, superior quality phone covers. Despite offering the best products, they were not even close to meeting their conversion goals.
The team decided to find out what was going wrong by tracking visitor behavior. Heatmaps and session recordings showed how visitors interacted with their new offering. After studying the data, some key findings surfaced:
- Visitors dropped off on the customize phone covers page
- Visitors who dropped off spent the most time on the phone specification & personal details pages
Looking at this data, the team narrowed down actionable insights –
- Reduced the number of steps on the customize phone covers page
- Make phone specifications more visual
- Reduced form fields on personal details pages
While this worked, it did not get the expected uplift in conversion, and the team struggled to find reasons and fixes.
Does this sound familiar to you?
While chasing data to fix isolated friction points in the funnel streamlines the buying journey, it does not make the journey contextual or relevant to user segments. Visitors expect relevant experiences and want to feel valued at every touchpoint.
A delightful experience is a mix of experience optimization and engaging with your audience at the right touchpoints. Personalization aids in achieving the latter by helping you release sharp audience-specific contextual and personalized interactions based on user journeys. For instance, rather than simply reducing form fields to reduce drop-offs, the phone accessories retailer can leverage personalization to auto-filter and show customization options relevant to the visitor based on the device they’re using or auto-fill details for repeat customers, and so on.
Similarly, if a visitor on your website is from the US while another is from Germany, the German visitor might expect a local language experience on your website. Or, users who have an affinity for luxury brands are likely to be put off if the most relevant results show discounted brands on the product listing page.
Besides this, visitors also need contextual information relevant to their journey to make a buying decision quickly. Personalization enables this. For example, you can nudge someone visiting a product page forward by showing positive product reviews as a notification triggered at the right time.
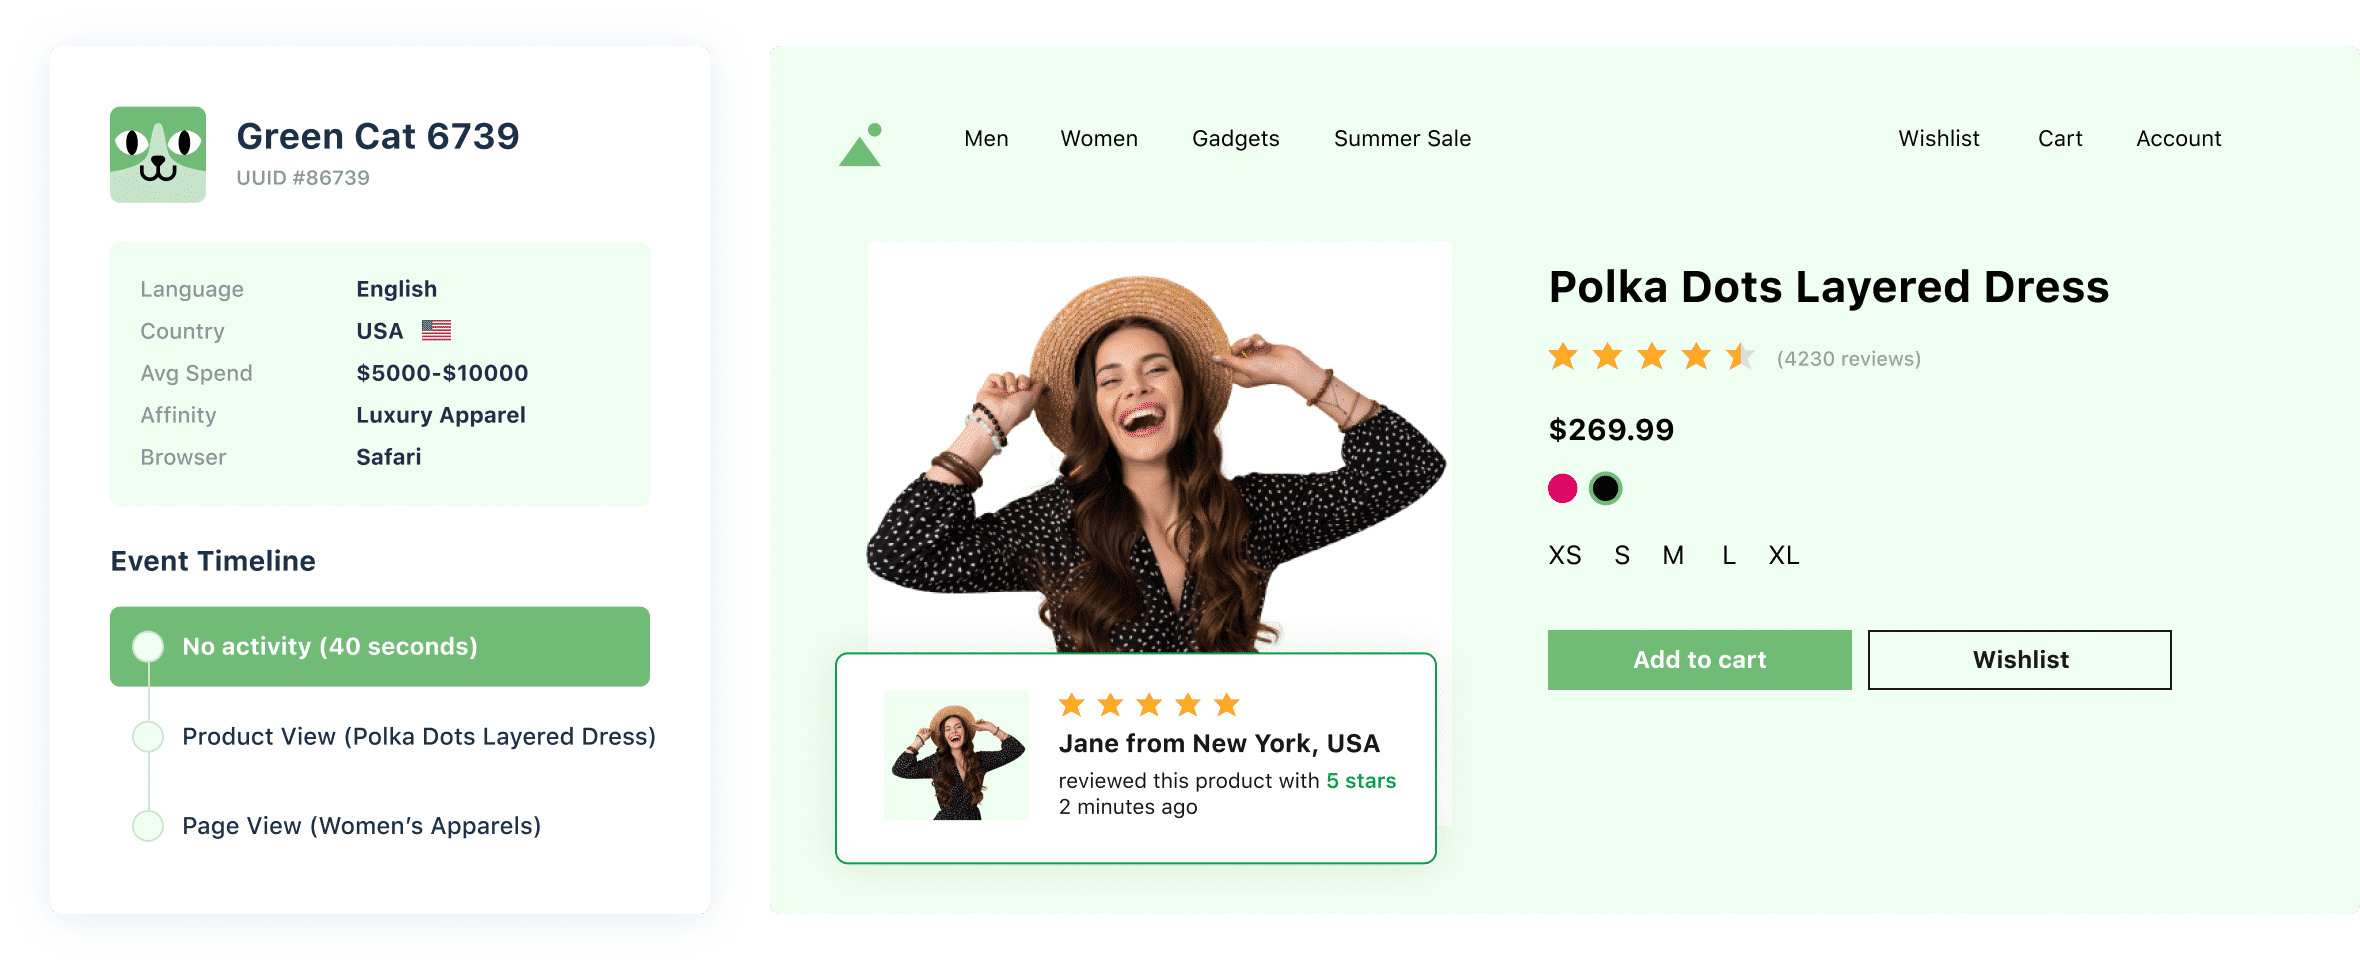
While these are some common examples of how businesses can create personalized experiences, there is no limit to what you can do. Irrespective of what your unique use case is, personalization always starts with your users’ data.
Data in personalization – All you need to know
Websites gather a vast amount of raw visitor data that has the potential to unlock valuable personalization opportunities. But to make the most out of the data you already have, knowing what type of data enables personalization is paramount.
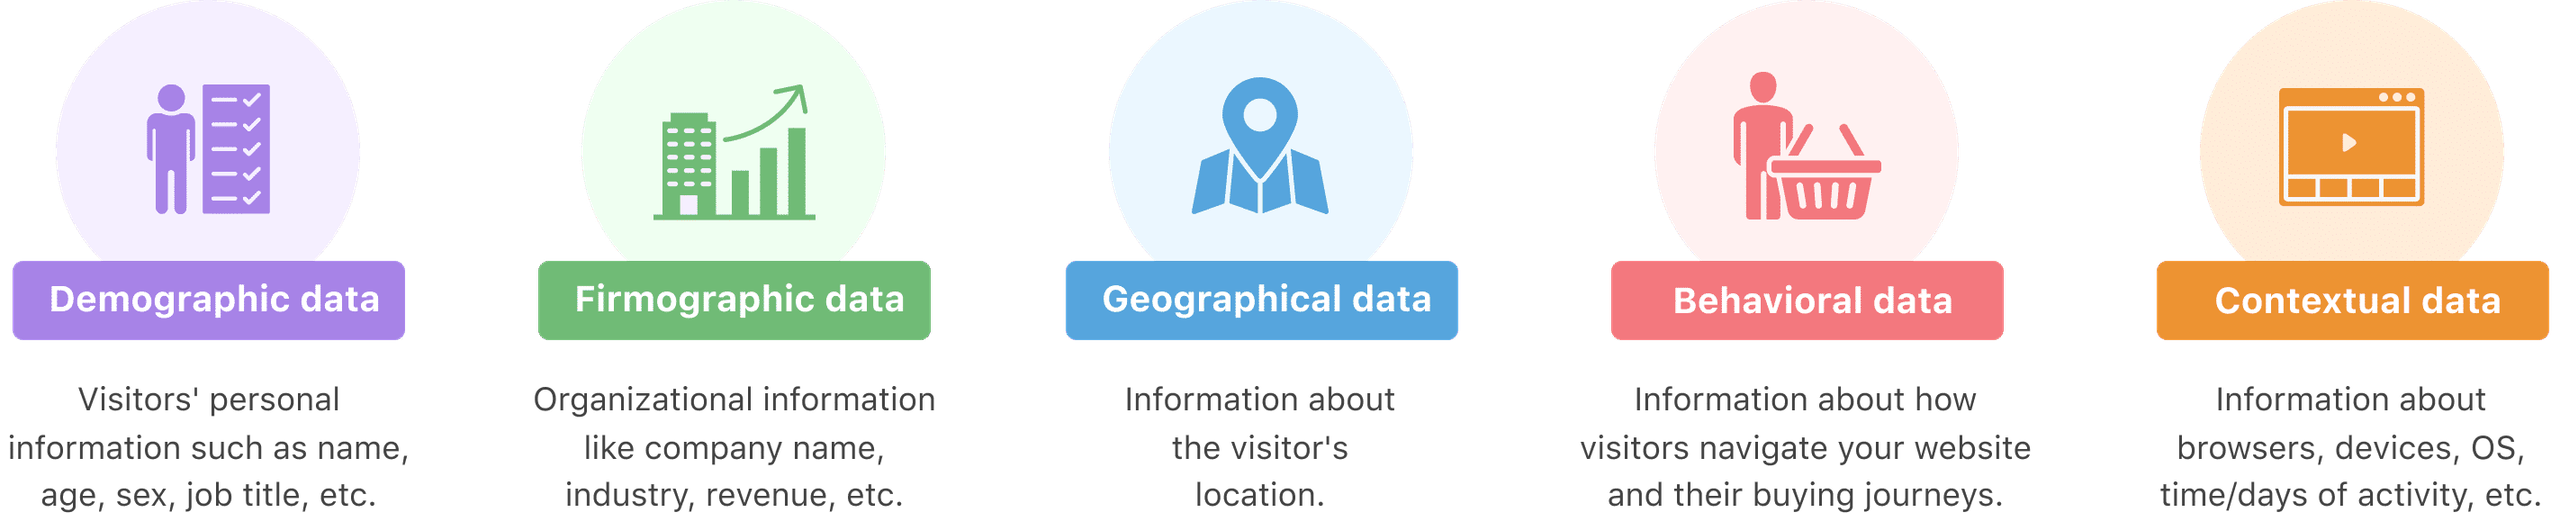
A single view of enriched and intelligent data lets you craft experiences that convert. With digital advancement, surface-level personalization is not enough. The above data empower marketers to create behavioral micro-segments of website visitors, so they get personalized experiences at the right time in their journey. This data is collected from multiple sources and unified at one central customer data hub so that you can visualize and learn from your visitors’ behavior and leverage it in your optimization campaigns.
Let’s look at some ways you can define your audiences using raw customer data:
1. Pre-defined segments
You can build visitor cohorts using pre-defined behavioral, geographical, demographic, and contextual data in this segmentation method. You can also create micro-segments combining one or more of the above data sources.
The phone accessories online retailer mentioned earlier can use pre-defined data points (like device and browser used, location, behavior on site, past purchases, etc.) to create user cohorts, plan segment-specific campaigns, and only show them relevant content.
For example, they can segment visitors and deliver personalized content to reduce drop-offs on the customize phone covers page. Or show first purchase offers to new users to motivate them to complete the purchase. A micro-segment of iPhone 13 Pro users visiting the website for the first time and through a Chrome browser can be shown a special discount to nudge them to complete the purchase.

2. Custom attributes-based segments
Segmentation based on custom attributes helps deep-dive into visitor behavior and ascertain how specific segments respond to your experience. Contrary to pre-defined segments that cover generic visitor attributes, custom attributes help build cohorts using non-standard, domain-specific attributes that match your campaign goals. These are extremely flexible and allow you to create hyper-personalized interactions by filling in the gaps between pre-defined segments.
Imagine you are an eCommerce store collating and analyzing conversion rates. You notice that premium members convert at 10%, whereas general buyers convert at 2%. Using this data, you can go very specific, run targeted promotions for the general buyers to nudge them further into the funnel, and increase conversions from this segment.
Similarly, you can create custom segments based on attributes like visitors’ last visit to your website, guest visitors vs. members, monthly spends, buyer personas – discount, impulse or FOMO, frequent flyers, loyalty customers, top 5% ace gamers, and more.
3. Third-party data-based segments
Another data source that comes in handy when segmenting visitors based on external parameters is third-party tools and integrations.
For example, using Mixpanel, you can create cohorts of inactive users who haven’t used your product or app in the last week, craft re-engagement campaigns, and deliver personalized content to them for higher retention.

Similarly, using Clearbit’s data, like a company’s IP address, you can deliver personalized content on the homepage banner to visitors from a specific company or industry. B2B companies can leverage Demandbase to identify companies that match their defined ICP, create a segment of high intent prospects, and deliver meaningful information that helps convert companies on their very first visit to the website.
4. Uploaded visitor lists
Uploaded visitor lists consist of external data like stored cookie data, POS data, URL query parameters, premium user lists, etc., that you can import and use to create deep visitor segments. You can then run hyper-personalized marketing campaigns for these segments.
Let’s assume that you are an online gaming company. You want to target the top 10% of users of your game for a particular campaign. Working with the engineering team, you can get a list of every user that qualifies with their unique cookie value. You can deliver the desired experience using robust experimentation engines that let you upload this list onto its database.
These data sets create an invaluable collection of insights that can enrich your visitor interactions at every touchpoint. But knowing how and when to use them is critical to ensuring your campaigns’ success. Let’s look into some industry-specific use cases of personalization that help businesses create a differentiator from their competitors.
Personalization is for everyone
Whether you’re an online retailer looking to increase AOV, a SaaS firm striving to reduce churn, or a publishing house looking for more subscriptions, personalization helps businesses across industries gain deeper behavior insights and design delightful experiences that resonate with every visitor. If you are an online business looking to maximize ROI from existing traffic, build stronger visitor relationships and ultimately drive growth by delivering relevant experiences, read on to know how you can leverage personalization to activate your audience.
eCommerce
A study by McKinsay suggests that 80% of online shoppers want personalization from retailers. These potential buyers on your website that you want to convert come from varying geographies and demographics looking for various products. The same shopper may like shoes from Retailer A but not their joggers, some visitors may only shop during sales, and so on. And there is a cut-throat competition to acquire these prospective buyers. With personalization, you can dive deep into granular buyer behavior, and design tailored experiences so they choose you over your competitors.

Micro-segmentation for increased revenue
Using data like geo-location, past purchases, product affinity, etc., you can curate personalized offers and category pages, recommend products to cross-sell, upsell, and more.
For example, you can auto-apply filters on category, listing, and search pages, so visitors only see relevant products. This makes it easier for them to navigate through the products and increases sales.
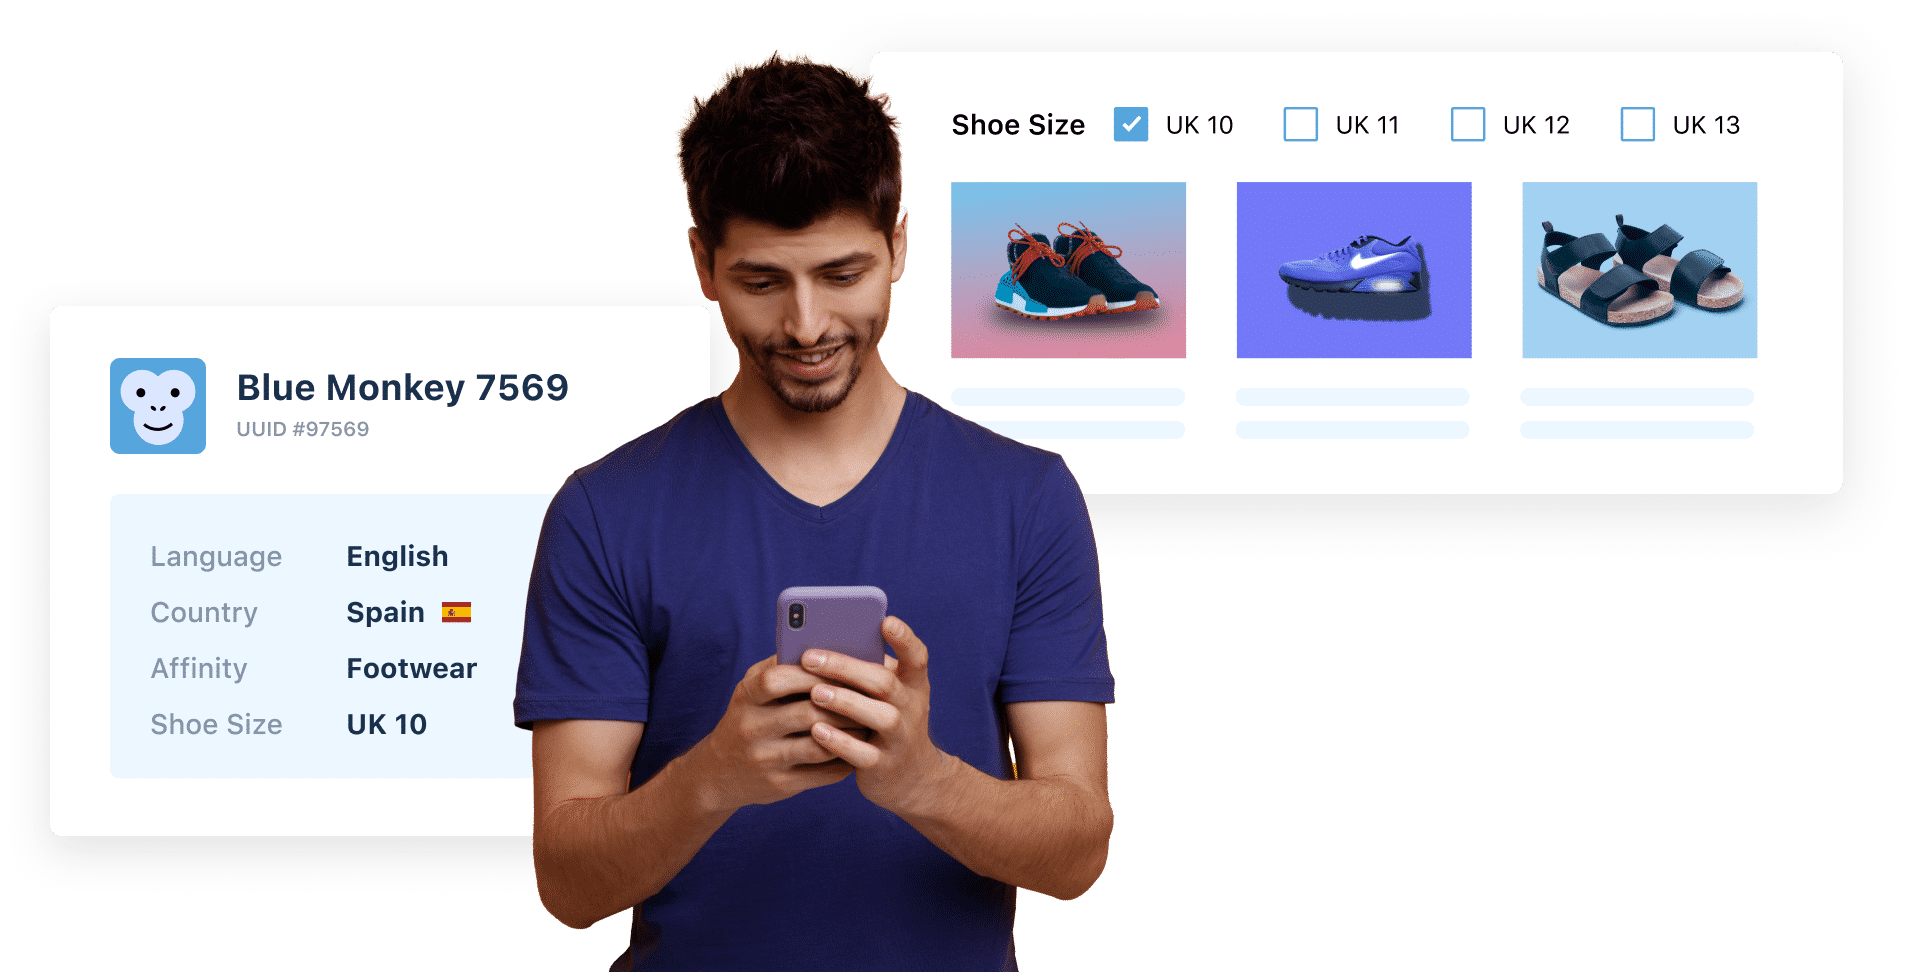
SaaS
All SaaS companies aim to keep churn at a minimum. Their subscription-based model demands building long-term relationships. Leveraging personalization to design and deliver tailored experiences for visitors rather than a general spray and pray approach shows that the company values them and helps inculcate brand loyalty.
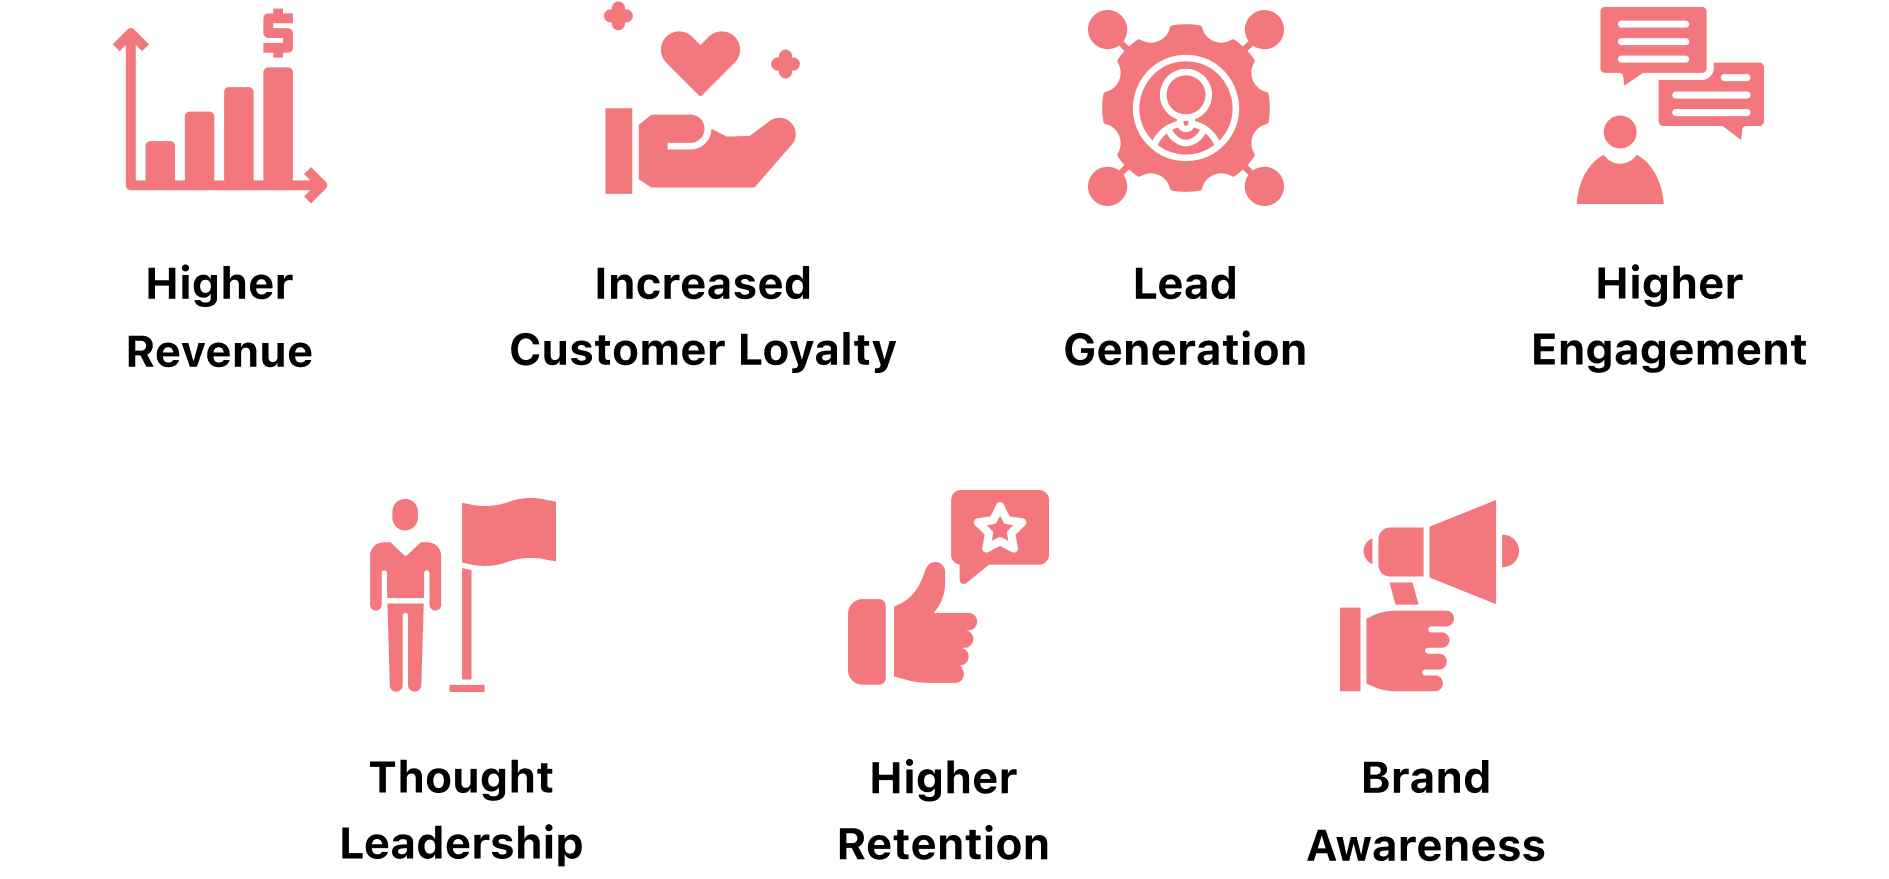
Personalized pricing and content for increased revenue
The pricing page is one of the most critical elements. You can create segments based on attributes like company size, revenue, etc., and craft experiences that match visitor expectations. For instance, you can personalize the pricing page to hide self-serve pricing and only show the “contact sales” CTA to Enterprise businesses while showing pre-set pricing to SMBs.
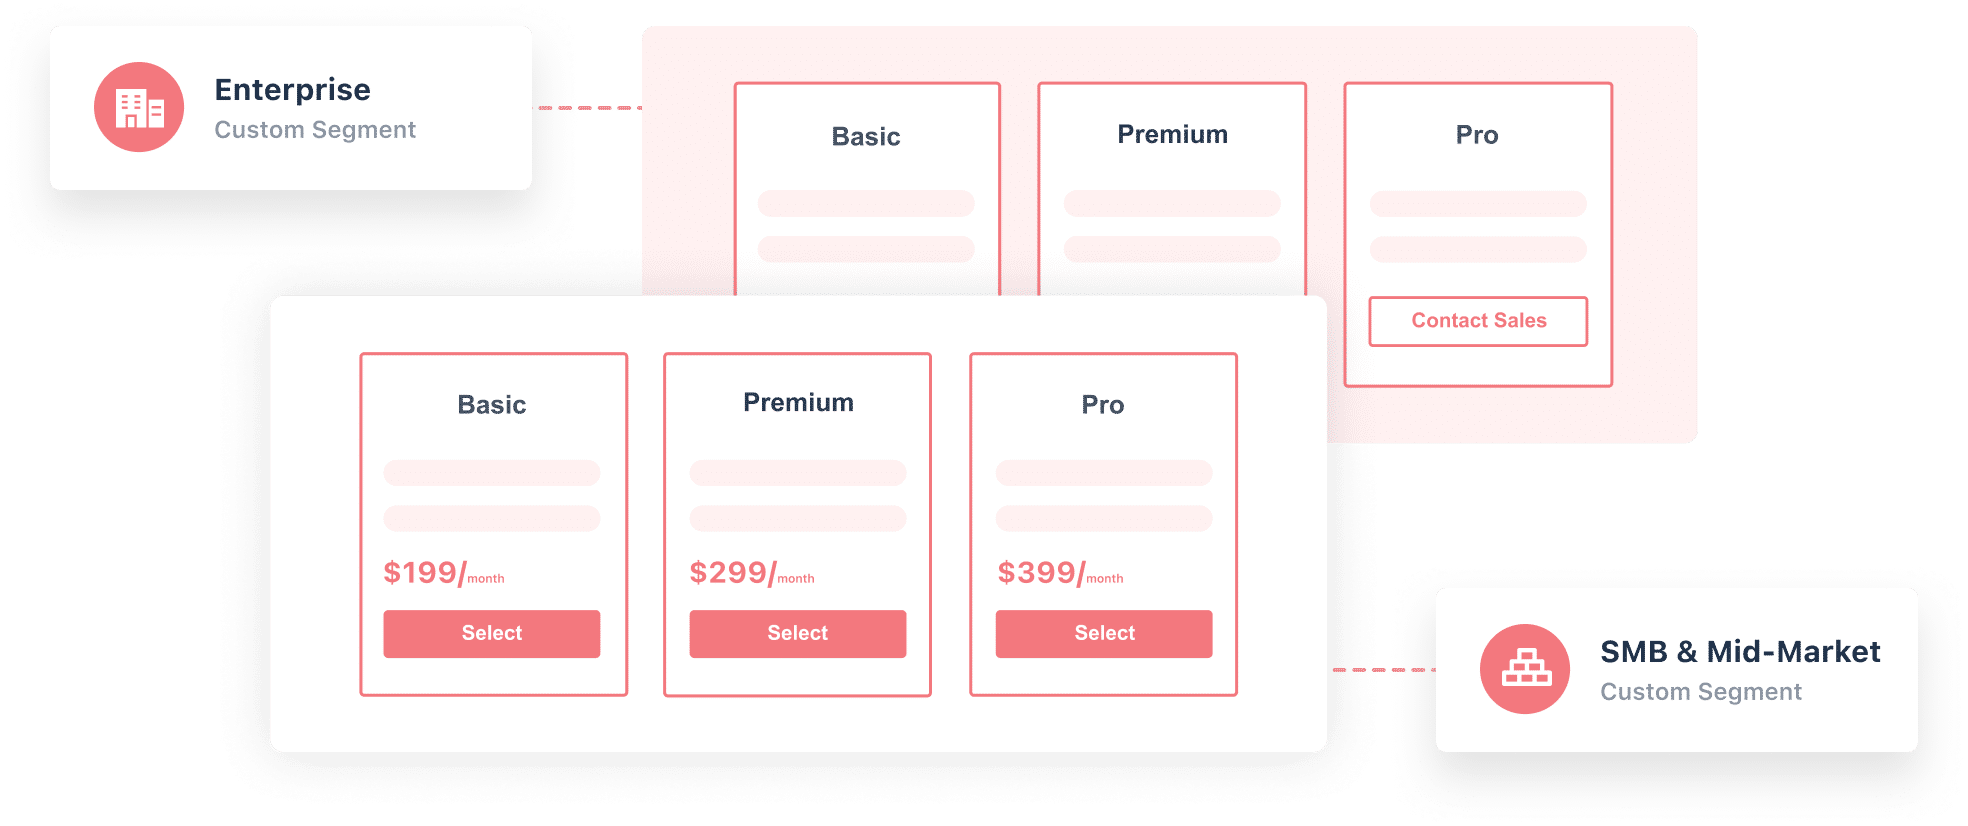
Marketers who evaluate a SaaS product conduct thorough research to find social proof. Using data from third-party tools like Clearbit, you can detect the visitors’ company/industry and trigger relevant logos, testimonials, and success stories. You can also track if the visitor has signed up for a free trial and craft the messaging so they only get content that nudges them further into the conversion funnel – from free trial to paid.
Travel
The travel industry caters to a diverse customer base. The needs and expectations of travelers keep evolving. Hence, it’s crucial to understand each visitor and curate personalized experiences.
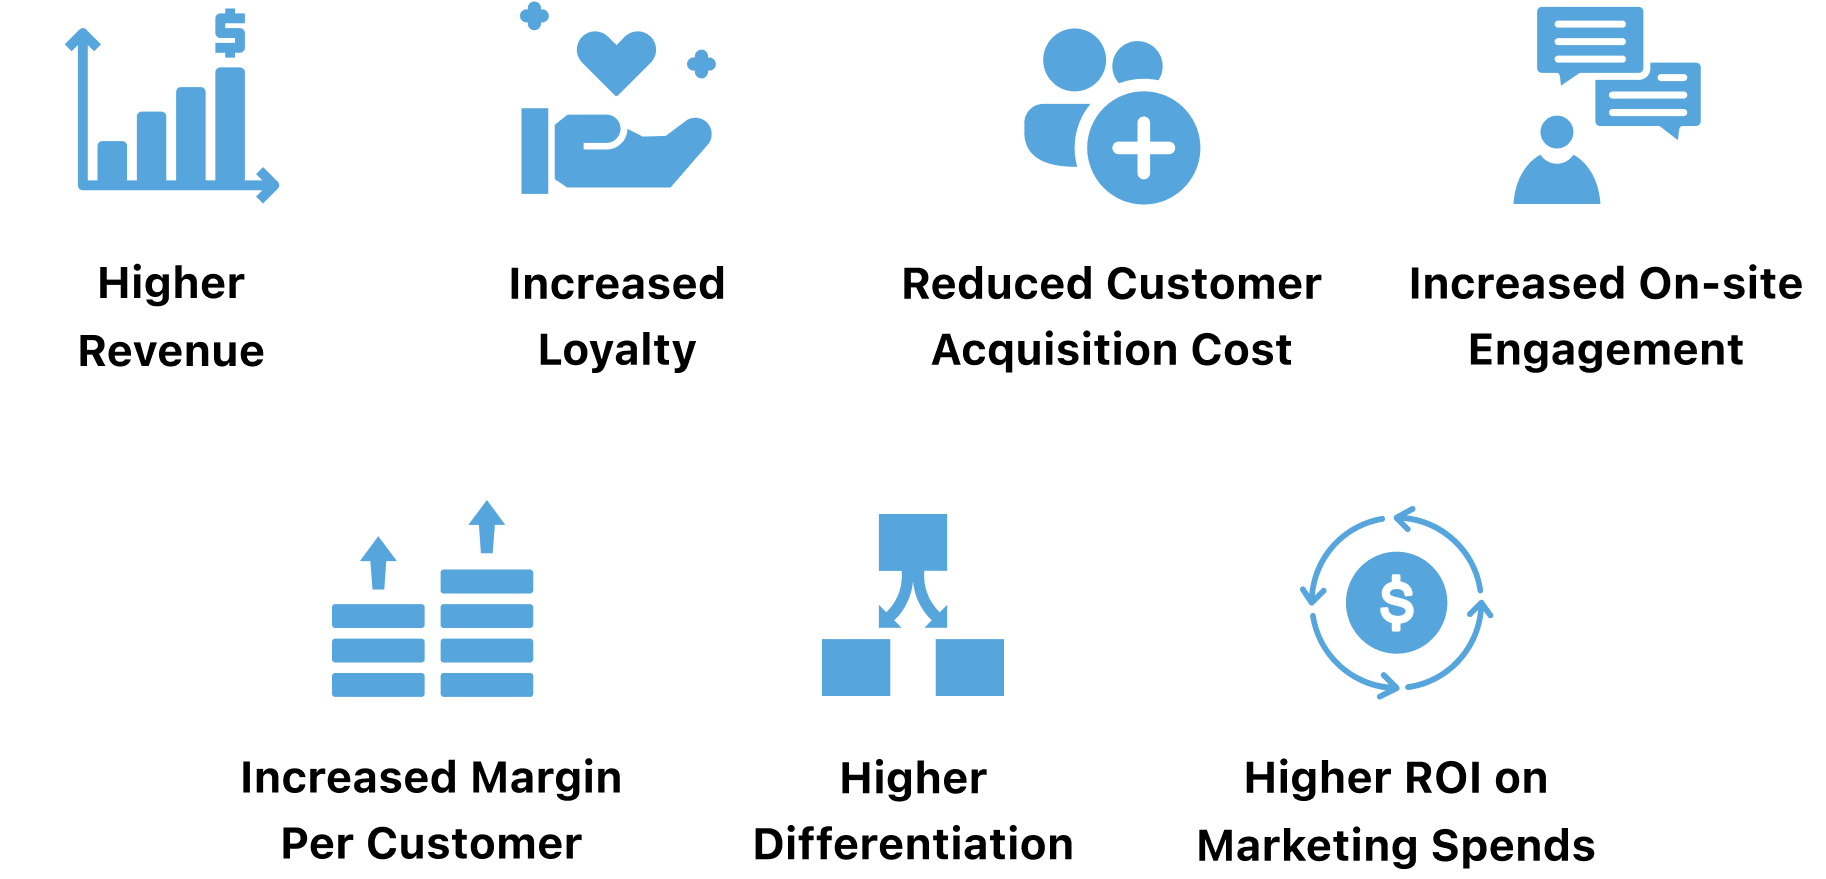
Demography & purpose-driven personalization
A majority of people travel for business or leisure. Once visitors enter travel details like date, destination, number of travelers, etc., websites can use the data to show them purpose-specific travel options & information.
For business users, show easy cancellation policies, boardroom facilities, how to get an invoice, etc. For leisure users, show activities, spa options, pool timings, 24-hour room service, discounts, etc. You can further break down the leisure demographic into more targeted groups.
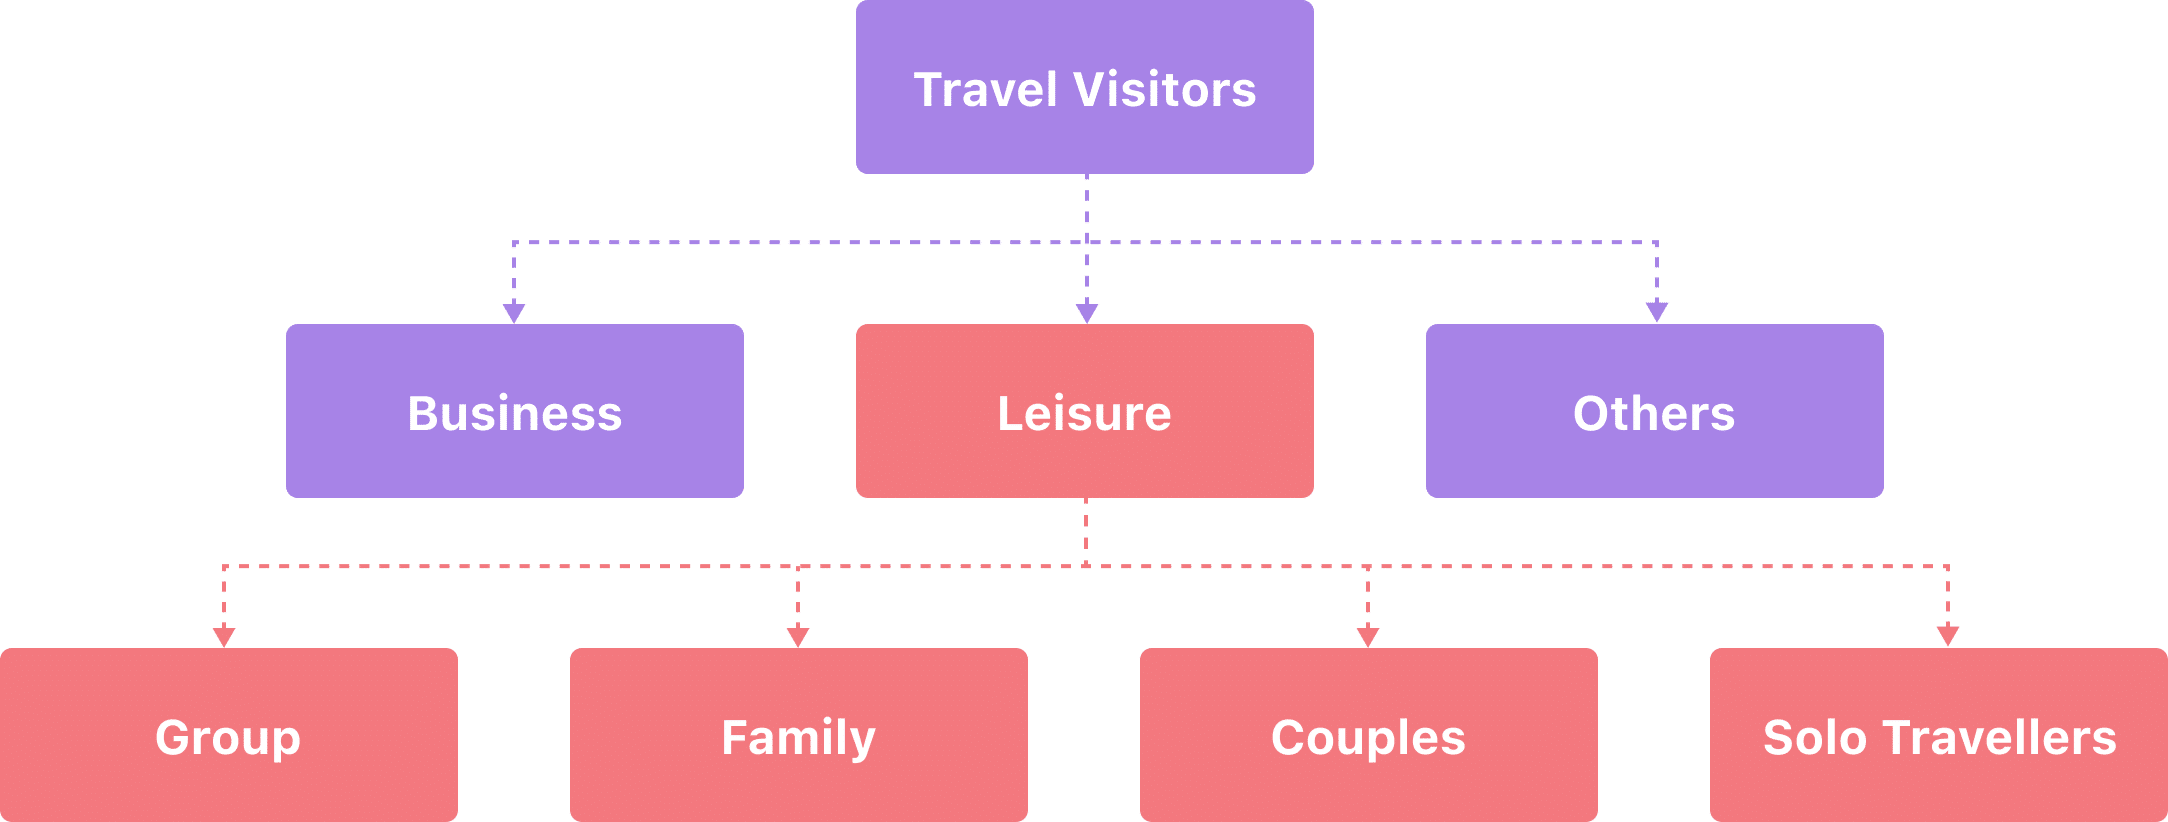
You can also pair cookie data with previous purchases, pre-select options in the booking flow, or change the ordering of search results to show the most relevant result first.
E-Learning
People respond more positively to personalized content – interacting, watching, reading more, and ultimately converting.

Personalize learning flows
Many e-learning platforms offer a multitude of courses. But, only a few of them manage to retain learners. Personalization enables e-learning platforms to break away from the linear approach where every learner follows a pre-set flow.
You can personalize learning flows with dynamic feedback and/or contextual pop-ups. For example, you can ask learners to take a quiz at the beginning of the course to assess their abilities and recommend the next steps. This creates a personalized flow for each learner that matches their skills and expectations.
You can also offer dynamic feedback that reinforces good behavior or applauds achievements. For example, once a learner completes 50% of the course at a good pace and shows progress, you can trigger personalized pop-ups encouraging them to complete the course.
Leveraging contextual data about visitors, e-learning platforms can curate personalized pathways for each learner, thus giving them more control over the course they pursue.
Media
Personalization has already revolutionized content consumption and monetization. It helped Netflix become one of the largest OTT platforms. It has brought huge revenue uplift for social media giants like Instagram and TikTok by pushing content and ads based on what users engage with most on their platforms.

Personalized recommendations for increased subscriptions
When users easily discover content they like, they continue using your platform. And when they find value in your content, subscriptions skyrocket.
For instance, an online editorial news portal can increase readership and subscription by using behavioral data to show relevant news items first. If a visitor mostly looks for sports news, it can show them sports-related content first. If a visitor often reads political updates, show similar content to get them hooked.
How to personalize with VWO?
At the start of this blog, our phone accessories retailer had actionable data but lacked the means to design and release the right experiences across every touchpoint at scale.
To bridge this gap and empower businesses to deliver hyper-personalized journeys at a scale that accelerate growth, we recently launched VWO Personalize. With this latest addition to the suite of VWO products, we aim to connect every aspect of personalization so businesses across industries can unlock infinite growth possibilities. You can create multiple tailored experiences and target each of them to a different visitor segment in one single campaign without depending on your development teams.

VWO Personalize starts with helping you build cohorts using raw visitor data. It then lets you curate and release experiences using the widget library and code editor in our powerful WYSIWYG Visual Editor:
– Create personalized experiences in a couple of clicks using our Widget Library, where you can access a range of pre-designed, ready-to-use widgets. Drag and drop any existing template and design personalized experiences quickly. In the library, you can find widgets for banners, modals, scroll to the top, countdown timer, social share, and more. You can also use dynamic texts in the content to further hyper-personalize the web page catering to individual segments.
Suppose you want to run a sale campaign on your homepage for a specific visitor segment. In that case, you can go to the Widget Library in the VWO Visual Editor, select the type of banner you want to add to the page, edit its content, and voila!
Similarly, if you are an online retailer looking to increase sales in the US region, you can add a sale countdown to specific product pages and deploy it for visitor segments you want to target. With our Widget Library, you can design as many hyper-personalized experiences for your visitor segments within minutes.
– When you want to deliver something unique, create custom templates with our Code Editor. Insert custom Javascript codes and variables into your website and build your own unique widget and experience that match your campaign goals.

Let’s say you want to add a hover effect on your product pages. Using our Code Editor, you can simply write a custom CSS or Javascript code and deploy it on the pages you’d like. Take a free trial or request a demo with our product experts to understand how VWO Personalize can help your business achieve unprecedented growth.
Personalization vs. privacy – Striking a balance
Throughout this article, we’ve discussed how visitors leave behind data trails with each online session. Companies capture this data daily to use it to personalize campaigns and interactions. But, the amount of data gathered also calls for concern about misusing visitors’ data without their knowledge. Inevitably, while visitors prefer personalized, contextual experiences, there is an inherent fear that couples it.
The question facing companies is how to use this data for personalization without breaching privacy and security. Many regulations like the European General Data Protection Regulation (GDPR) have been implemented to address this.
But companies need to take the onus of responsibility. To win visitors’ trust, they must do more than just fulfill the regulatory requirements.
Companies must ensure that their personalization practice is always compliant by adopting a privacy-first approach that ensures privacy and data safety. They must constantly update security controls with evolving data protection regulations and reforms.
Maintaining transparency about data collection, storage, usage, and what businesses do to ensure its safety is critical.
With VWO Personalize, you run data-driven campaigns and release hyper-personalized experiences while ensuring absolute data privacy. It is designed with a privacy-first approach, complies with global data protection norms, and comes with airtight controls that ensure your visitors’ privacy.
What next?
Customized covers of superior quality were the USP of our online phone accessories retailer. The irony was that most visitors were dropping off on the customized page itself. The changes made didn’t help since they were non-targeted blanket changes. Personalization fills this gap.
With personalization, our retail guy can:
- Implement auto-filtering and show customization options relevant to the visitor based on demographic data like age or gender & contextual data like phone model used
- Trigger location-specific payment options
- Trigger offers and dynamic content based on the buyer stage a visitor is on
This list is not exhaustive, and the possibilities to personalize are infinite. Visitors expect personalized experiences. If they don’t get it on your website, they will move on to the next available option. So don’t lose out on any more business. Start your personalization journey and unlock unlimited growth opportunities to scale your business now.
]]>