How to Use Experience Analytics to Reduce Your App’s Churn Rate
If you’re a product manager and believe that you’ve created an app that your audience can’t get enough of, and they’ll keep coming back, you might be deluding yourself.
Time for a reality check!
According to research on worldwide retention rates, the churn rate for mobile apps starts at 74.7% on Day 1 and gradually increases to 94.3% by Day 30. In other words, the retention rate across 31 mobile app categories is 25.3% on Day 1 but drops to 5.7% by Day 30.
If you are running a gaming app or a publishing app, losing users means they’re disengaged. For eCommerce or delivering apps, it can seriously impact your revenue goals.
So, what is the solution to reverse this churn trend? In this blog, we will tell you how to tackle the problem at its core using the power of experience analytics.
To understand where to start, you first need to calculate the churn rate for your app.
How to calculate churn for your app
The lower your churn rate, the better. A higher churn rate means more effort is required to improve user engagement and retention.
Imagine you run a subscription-based streaming service. You want to calculate churn for your app to understand user engagement and make strategic decisions to improve retention if needed.
Let’s say your app has 40,000 active users at the beginning of a month, and by the end of the month, 28,500 have stopped using your app. You can calculate the churn rate of the month, using the formula below.

In this hypothetical scenario, your churn rate stands at 71. 25% and needs immediate fixing. To do so, understanding the reasons behind the churn becomes essential.
Why do app users churn?
According to a survey of 2,000 users, the primary reasons for app uninstallation are as follows: not using the app (39.9%, limited storage (18.7%), and excessive advertisements (16.2%).
It is evident that non-usage commands the lion’s share as the primary driver of app churn. To uncover what drives users away, there are some key questions you must find answers to.
Why did users drop off from the app and never come back?
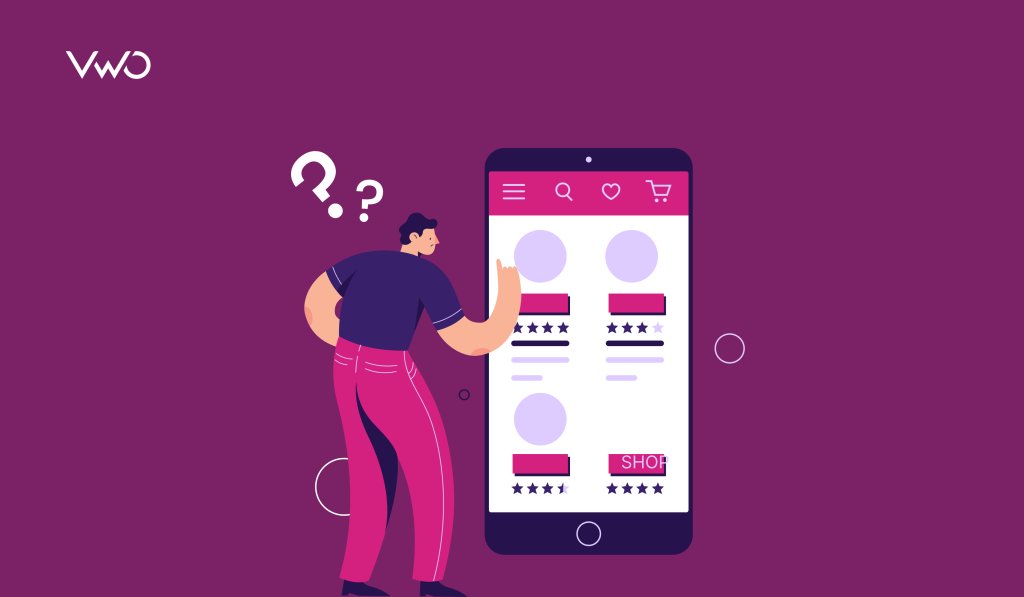
Take an objective look at your app. Is its navigation cumbersome? Imagine using a different app with such difficulties – would you stick around? Challenging navigation increases the cognitive load on users, which can drive them to abandon your app.
Further, intrusive ads alone can drive away 16.2% of users, making them one of the top reasons why users drop off from an app.
Users constantly crave novelty. If your app stagnates, lacking updates or new features that align with users’ preferences, their interest will wane.
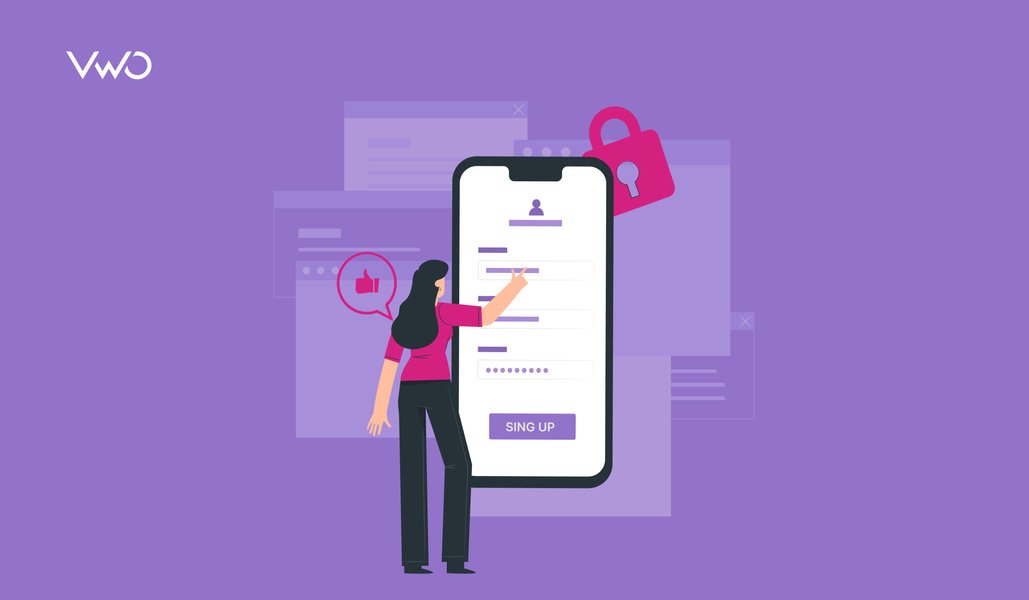
Additionally, if your app lacks security features, privacy concerns can lead users to drop off and seek more secure alternatives that better cater to their needs.
Why do users sign up but are not active?
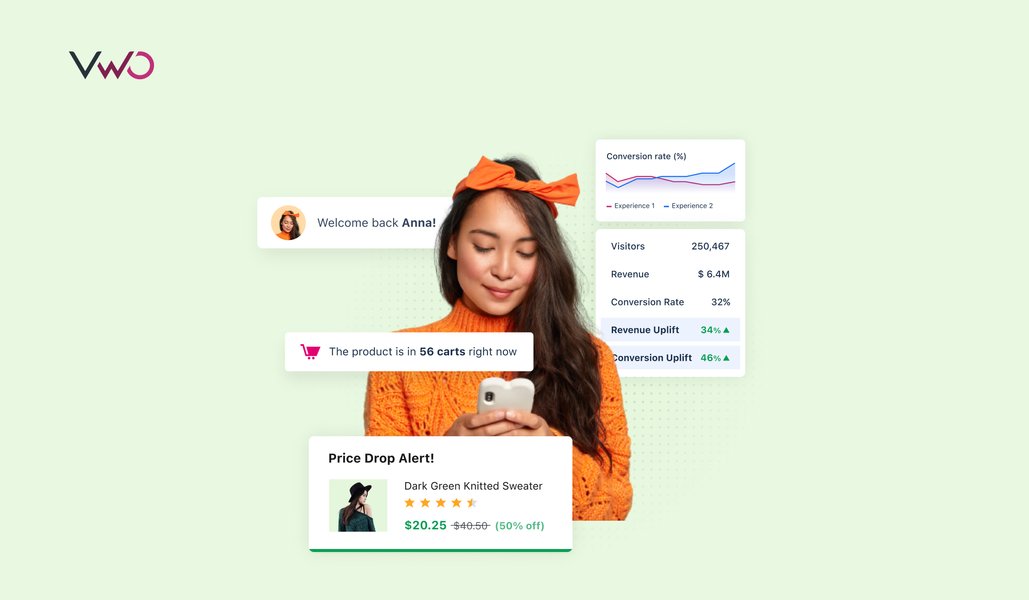
Generic content or offers blow out users’ interests faster than you think. 63% of smartphone users are more likely to purchase from companies whose mobile apps offer them relevant product recommendations. So, it’s worth checking if your app is missing that personalization angle.
Now, think about users who signed up but aren’t doing much. Could it be because your app is like a maze, making it tough for them to derive the right value from your app? Users do not have the time or patience to embark on a treasure hunt in your app.
Your app should be seamless enough to enable users to achieve their goals efficiently, providing the expedition they need.
Why do some users come back to your app? And how is their experience different from the ones dropping off?
At times, users simply choose to disengage. This change of heart has become increasingly common in today’s digital world, with several options available online. However, if you still see users returning to your app, it shows that your app offers something valuable that resonates with your audience. Some of these returning users may be your loyal customers who trust your brand and your app.
On the other hand, certain segments of users who drop off to the point of never returning may be seeking more personalized experiences. This trend is especially noticeable among Gen Z, where over 60% of them explore alternative options even if they have a preferred brand.
For them, a poor user experience, intrusive ads, or generic offers are the least accepted elements to be found on mobile apps today. To re-engage users who may be losing interest, optimize your app to leave a positive impression and foster trust.
We have touched upon the reasons why users may not be engaging with apps. But remember, user behavior can vary significantly from one app to another. To have users keep coming back to your app, you need to figure out the exact reasons behind their disengagement and fix them. How to do so? We discuss that in the following section.
What is user experience analytics all about?
When digging into the problems behind app churns, you will encounter two types of analytics offering a solution – quantitative and qualitative.
As the name implies, quantitative analytics deals with the numbers, and the measurable aspects of the issue at hand. Some of the key performance indicators (KPIs) we can measure using quantitative analytics include:
- Monthly active users: This tells us how many unique users engage with our app in a given month.
- In-app purchases: It measures the percentage of users who make in-app purchases.
- Average revenue per user: By calculating the average revenue generated per user, we can assess the financial impact of churn.
- Notification engagement: This metric informs us about the number of users responding to in-app or push notifications.
- Feature usage rate: It helps us gauge the adoption and usage of specific features within our app.
While these numbers provide valuable insights into user behavior and app performance, they don’t tell us the ‘why’ behind the numbers.
For instance, if we observe a consistent drop in monthly active users, it signals that users are disengaging with the app, but it does not explain why they are engaging in the first place.
This is where qualitative analytics becomes invaluable.
It goes beyond just the numbers, uncovering the reasons behind user behavior. Qualitative analytics reveals the friction points users encounter on our app, how they interact with various elements, and what drives them to churn.
Without these insights, numbers remain mere data points without direction.
However, when we combine quantitative and qualitative analytics, they provide a comprehensive understanding of why users are churning and how we can address these issues effectively.
Therefore, user experience analytics involves delving into behavioral analysis and comprises the following:
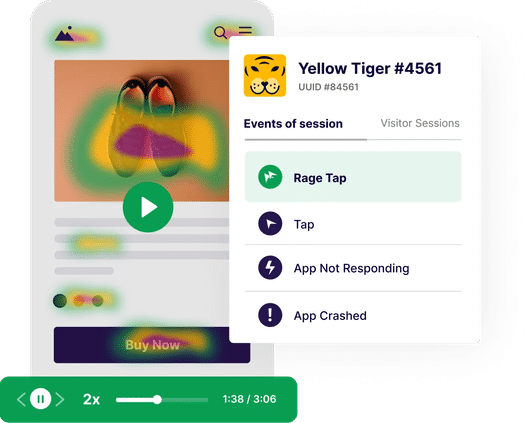
Watch the user journey with recordings
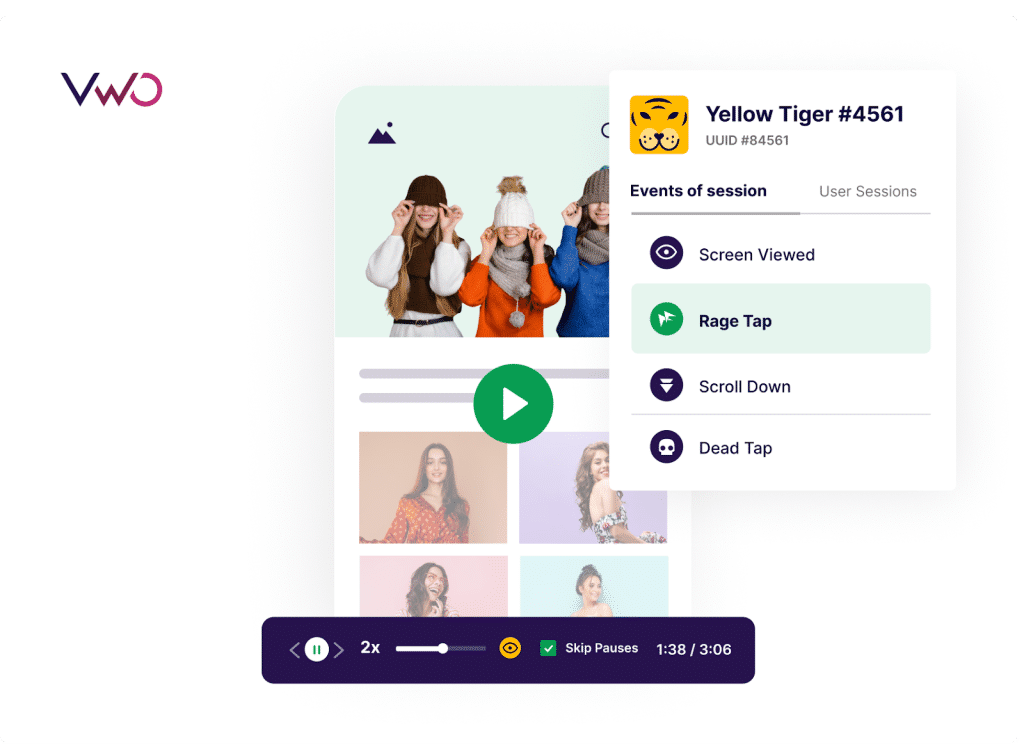
Session recordings are qualitative tools that capture real-time browsing sessions of app users, allowing you to review the recordings later to extract valuable insights into visitor behavior.
Visualize user engagement with heatmaps
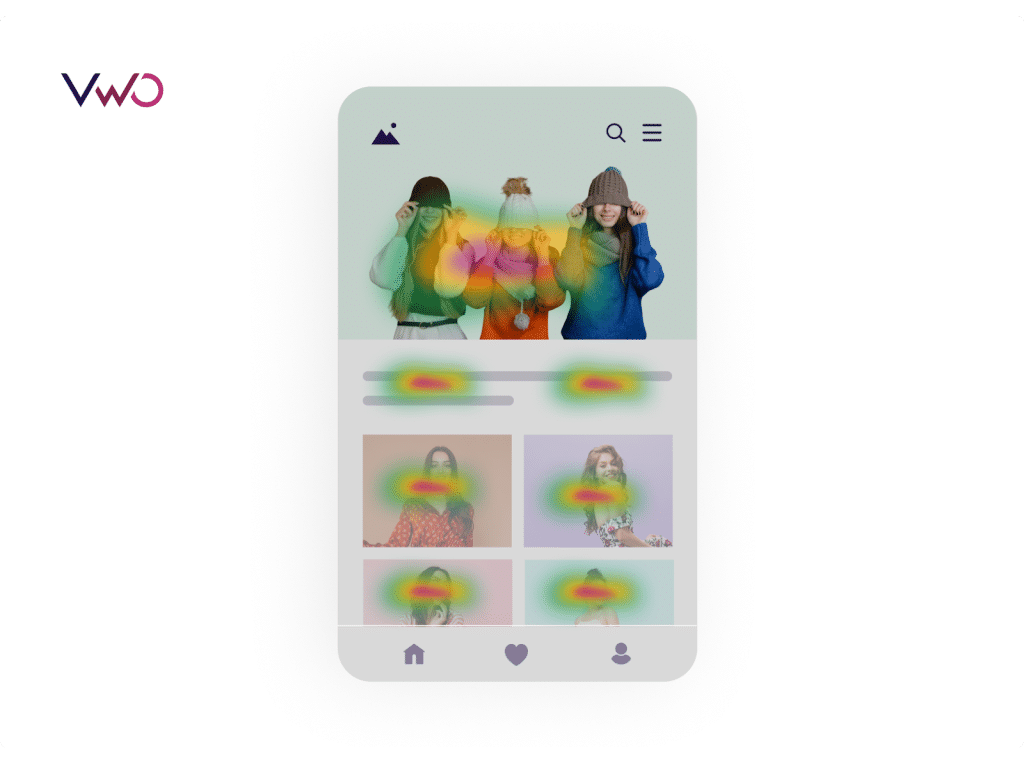
Heatmaps provide colorful visual representations of user interactions with different elements on your app. By using a color spectrum ranging from red to blue, heatmaps illustrate which elements on your app page are the most popular (hot) and least popular (cold).
Study-specific user cohorts
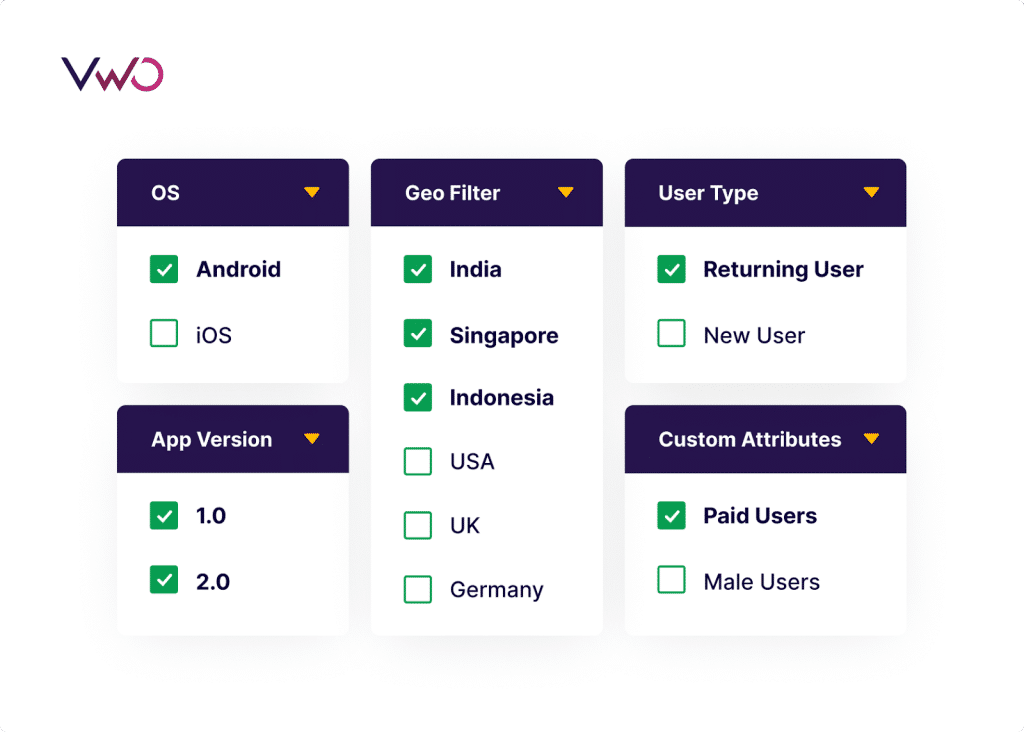
In experience analysis, you can study how users from different cohorts behave on your app. For example, you can observe the behavior of users from specific locations. New users and returning users are also two distinct cohorts that you can delve into to gain a deeper understanding of their specific behaviors. App version, device type, Android version, and iOS version are other user cohorts that can further be analyzed to examine user behavior deeply on the shared characteristics.
Our platform, VWO Insights for Mobile Apps, supports all these segmentation options and also allows you to create custom events specific to your app as filters.
Understand funnel drop-offs
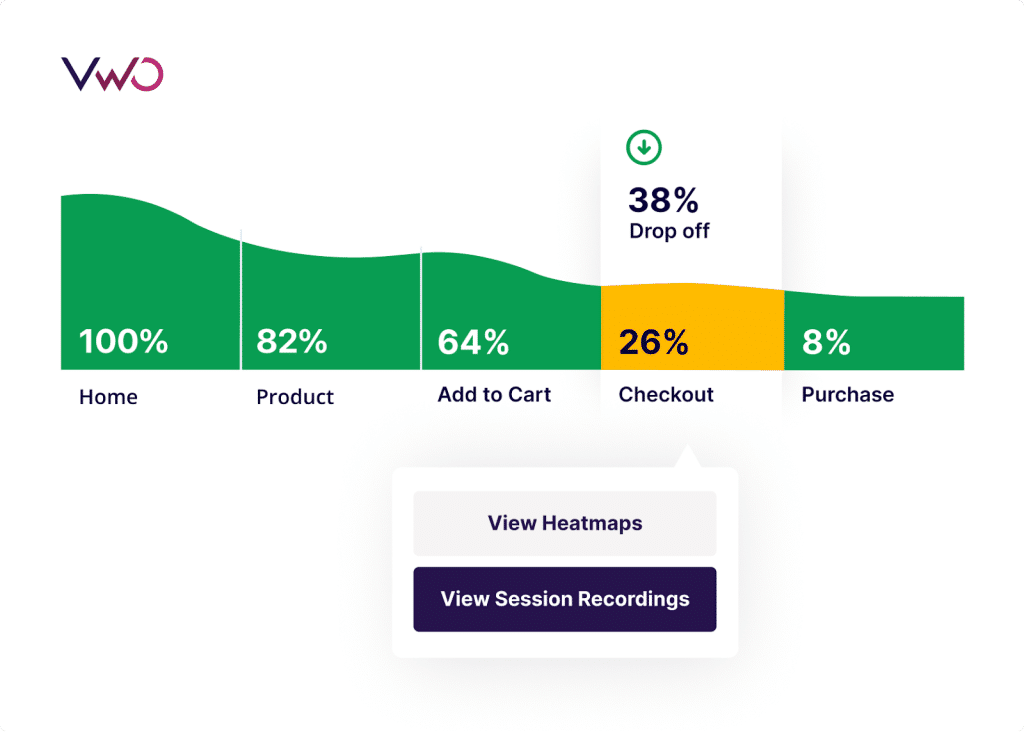
Funnels help you figure out where your users are losing interest and dropping off from your app. Funnel reports can also be filtered using different segments to deep-dive into user behavior across their journey on your app.
How to use user experience analytics to reduce your app’s churn
Regardless of the mobile app, resorting to user experience analytics allows you to zero in on user behavior and use the collected insights to improve the app even further. These enhancements directly contribute to higher user engagement and reduced churn rates, ensuring people stick around and enjoy the app longer.
Here are some use cases of leveraging user experience analytics from different industries.
Shopping apps
When it comes to a shopping app, session recordings can provide insights into user struggles or obstacles that lead to cart abandonment. For instance, you can determine if users drop off after trying and failing to access coupon code links on your app.
Heatmaps offer valuable information by highlighting which elements within your app receive the most user interaction.
For instance, if users are not scrolling down to view reviews, as indicated by the cooler blue areas on the heatmap, you may consider relocating them to a more prominent position at the top.
This approach enables you to design your app layout and arrange elements based on your users’ mental model.
How do they help reduce churn?
Let’s say quantitative analysis has shown that users are churning from your shopping app. You believe that adding items to their wishlist will encourage users to return to the app and reduce churn. Therefore, your goal is to improve wishlist additions to tackle the problem of churn.
But before you work on improving the feature, you want to understand users’ current level of interaction with it. So, you analyze recordings to see differences in behavior between users who add products to their wishlist and users who don’t. Interestingly, you see many users refrain from using the feature.
These observations will lead you to make UI changes and optimize the wishlist icon, making it easily accessible and shareable for users. This, in turn, will increase wishlist additions, providing an effective solution to reduce churn.
Food & drink apps
Food and drink ordering apps heavily rely on user experience analytics. Session recordings provide insights into how users browse menus and make selections, revealing any difficulties they may encounter in finding what they want.
This information enables you to make improvements in the menu design for enhanced user navigation.
Analyzing user behavior with specific dietary preferences or interacting with such filters can help you refine personalized recommendations. Filtering and watching user sessions by different times of the day can offer valuable insights into user behavior during peak ordering periods.
Similarly, heatmaps can highlight areas of increased user interaction, such as ratings or images, helping you plan their design and placement effectively.
How do they help reduce churn?
Consider you have added a new feature named “Nutritional intake” in your food app for every user. You have noticed that users who used this feature often returned to the app to see their accumulated nutrition/calorie data, which often led them to place orders from the app.
As the next step, you turn to session recordings to observe the behavior of users who are not using the feature and identify ways to encourage its adoption. For instance, placing the nutritional count on screens could attract users’ attention and drive more engagement.
Therefore, this UI change (or any other) guided by qualitative analysis can improve the feature adoption rate, drive more orders, and reduce churn from the app. But before you implement any change, be sure to run a test and confirm its effectiveness.
Finance apps
Session recordings help identify any difficulties users may have encountered while filling out loan forms, such as missing fields or incomplete information at certain steps. They provide a detailed view of user interactions leading to contact with customer support, allowing you to pinpoint areas where in-app guidance can reduce support inquiries.
If you are interested in assessing how users respond to newly added investment charts or graphs in your app, heatmaps can reveal their interactions, enabling you to optimize the layout and information presentation for better clarity.
You can also gain insights into user behavior when they make changes to their investment portfolios, identifying opportunities to offer guidance and support.
Finally, filter recordings by the hour of the day will help you understand how users react to market fluctuations of any kind.
How do they help reduce churn?
Let us say, you have observed a high churn rate on the ‘Add/Manage your payees’ screen of your banking mobile app.
To understand why users are dropping off, you have analyzed their behavior through session recordings and noticed that they tend to scan only halfway through the form and drop off without completing the necessary details.
Further, heatmaps show that users are attempting to click on the ‘Help’ button at the top, but it is inaccessible. Based on these insights, you can streamline the UI of the screen by retaining only essential form fields and making the ‘Help’ button accessible.
Finally, these changes will encourage users to fill out the form, complete the details, and seek help (if needed) with just one click of a button. Simplifying these actions will reduce churn and enhance user engagement with the app.
Travel & local apps
Travel & local apps can also benefit from the capabilities of user experience analytics. Session recordings reveal booking abandonment patterns and provide insights into user behavior and preferences when making last-minute travel bookings, allowing customized offers and support.
Further, filtering recordings by date will help you gain a better understanding of user behavior and preferences during peak travel seasons while filtering by screen resolution ensures a seamless mobile experience across different devices.
Heatmaps offer insights into user interactions with map views, guiding improvements in functionality and design. Further, you can track events of saving favorite destinations, thereby identifying ways to improve this feature.
How do they help reduce churn?
Imagine you have a brand-new travel and hotel booking app, and you have recently noticed a significant churn from the home screen of the app.
After investigating session recordings of the home screen, you discovered that a segment of users opening the app on older Android versions experienced app crashes when trying to make bookings.
Subsequently, you shared the recording with the development team, who promptly resolved the issue. As a result, the booking process became as easy as a breeze for users. And what’s more? The reduction in user frustration led to less churn, increased bookings, and improved user satisfaction.
Gaming apps
Gaming apps can also be improved with the use of these analytics. Session recordings highlight areas where users encounter challenges with controls or levels, providing insights for enhancing game design.
Session recordings also uncover user interactions with tutorials and guides, offering guidance for improving instructional content and overall design. Further, filtering the recordings by game version will tell you how updates or feature introduction impacts user engagement.
Heatmaps too can help you gauge which areas of your app users interact with the most and ensure optimal placement of offers, purchase prompts, and other elements.
How do they help reduce churn?
Suppose you have recently introduced a daily login reward system in your gaming app, offering users access to new content and in-game currency, all in an effort to reduce churn rates.
To gain insights into user reactions, you have analyzed both recordings and heatmaps. What you have discovered is a mixed response – while some users are actively engaging with the reward system, others are barely interacting with it.
You can conduct an experiment to enhance the placement and messaging of the feature, making it more prominent for users to engage with. This test can determine whether these changes will reduce churn rates and improve user experience.
Reduce app churn with user experience analytics starting today
Before you jump right into reducing churn, understand what is causing users to leave. Doing this will give your churn-controlling strategies the right direction.
VWO Insights for Mobile Apps is a robust user experience analytics tool that helps you pinpoint the root causes of your app’s churn. By leveraging insights from Session Recordings and Heatmaps, you can generate test ideas and optimize your app to boost retention and revenue growth.
Sign up for a product tour now and gain a 90-day free access to uncover the reasons behind churn in your mobile app.
Categories: